


 Comprehensive weather insights help safeguard your operations and drive confident decisions to make everyday mining operations as safe and efficient as possible.
 Learn how to optimize operations with credible weather and environmental intelligence. From aviation safety to environmental compliance, our comprehensive suite of solutions delivers real-time insights, advanced forecasting, and precise monitoring capabilities.
 Heavy Precipitation in the Northern Sierras Leads to Oroville Dam Crisis
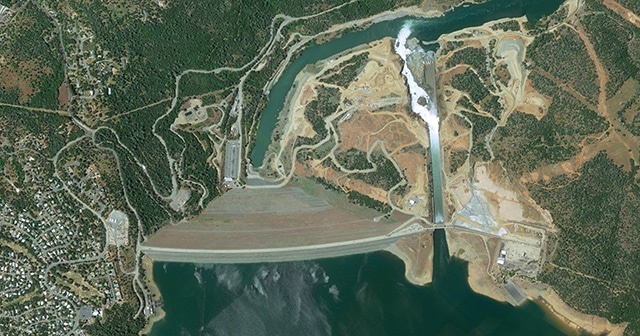
A dominant story in news headlines over the past few days has been the crisis at California’s Lake Oroville dam, the tallest earthen dam in the United States. Buoyed by weeks of heavy precipitation throughout much of central and northern California, the reservoir for the first time in its 49-year history exceeded its capacity and began to overflow into the emergency spillway (Figures 1 & 2). The temporary evacuation of some 200,000 people occurred on Sunday when engineers became alarmed by the rate of erosion at the lip of the emergency spillway. This came just days after standard releases from the dam began to cause serious erosion of the main spillway, necessitating the reduction of flows while engineers inspected the damage. While the erosion of the main spillway has apparently stabilized as of this writing, the emergency spillway remains potentially unstable if needed again before proper repairs can be made.
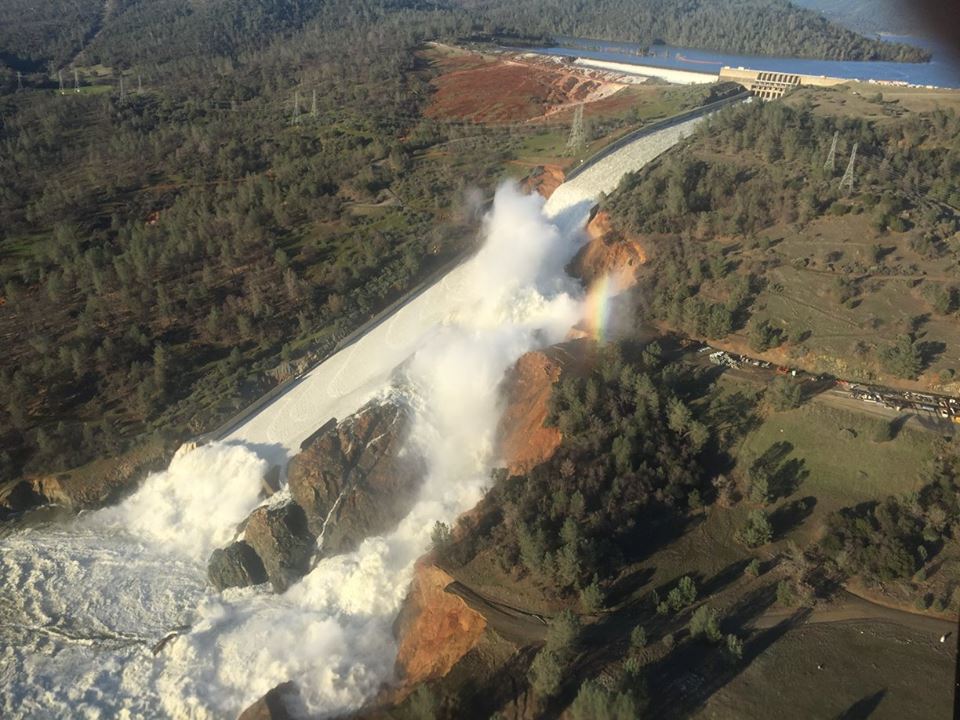
Figure 1. An aerial view of the severely eroded main spillway of Lake Oroville on Saturday, 11 Feb 2017. Water can also be seen running over the emergency spillway above and to the left of the main spillway. Image credit: Wikimedia Commons.
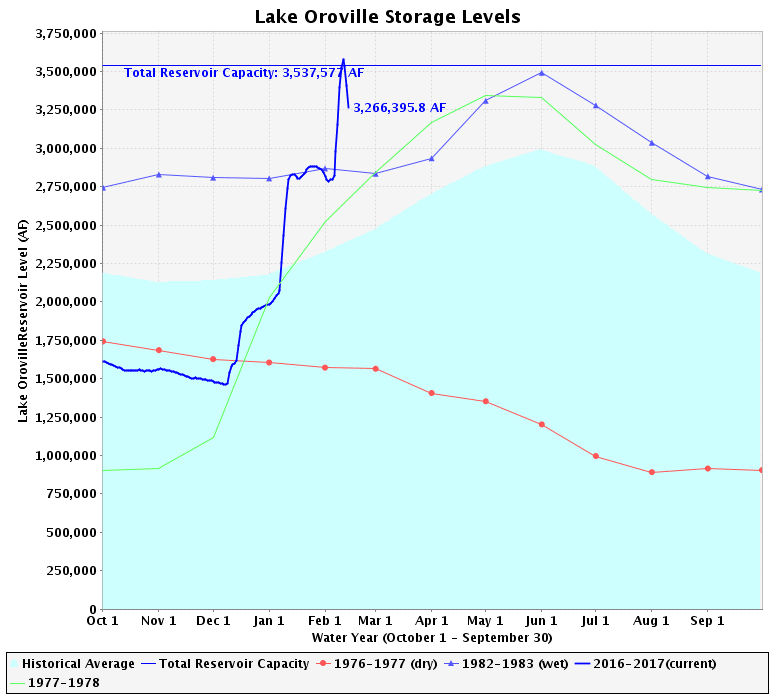
Figure 2. Lake Oroville water storage levels in 2016-2017 as compared to other historically wet and dry years. Image source: CA Dept. of Water Resources.
As indicated by the water storage graph in Figure 2, water levels have spiked sharply multiple times already this water year (water years run from October to September). These spikes are the result of a series of powerful low pressure systems that have produced copious amounts of precipitation over the Lake Oroville catchment area, particularly in the mountains. Since mid-December, there have been at least four major storm systems that produced widespread storm-total liquid precipitation totals in excess of 10″ (Figure 3). Above 6,000-8,000 feet in elevation, much of this moisture remains locked up as snow and will only gradually contribute to the flow of water into Lake Oroville. However, as evidenced by the time series below, taken at a point at just 3,300′ elevation, the extremely heavy precipitation has also occurred at lower, warmer altitudes, where almost all of it becomes immediate runoff.
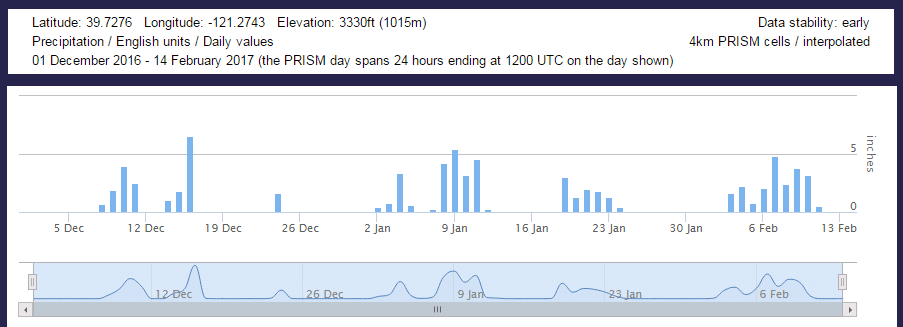
Figure 3. A time series of analyzed daily precipitation values at a point in the mountains upstream of Lake Oroville. Image source: PRISM Explorer.
Based on this time series, MetStat, now DTN, decided to analyze four recent weeklong periods of precipitation in the Oroville drainage area: 10-16 December 2016, 5-11 January, 19-25 January, and 4-10 February. Gridded precipitation data was acquired from NOAA’s Multi-sensor Precipitation Estimates (MPE) and compared to precipitation frequency grids from NOAA’s Atlas 14 Vol. 6 to produce the Average Recurrence Interval (ARI) product. The ARI shows the approximate rarity of an event expressed in terms of the average amount of time that would be expected to pass between events of identical magnitude. In other words, an ARI value of 200 years would indicate a storm that would only occur once every 200 years on average. The images below show the storm total precipitation for each event on the left and the 7-day ARI on the right.
Note that while no individual storm is incredibly rare individually, the combined effects of a 1-2 year storm (storm 1), a 10-25 year storm (storm 2), a common but heavy storm (storm 3), and another 10-25 year storm (storm 4) all in succession has led to some truly staggering rainfall totals. This is illustrated most starkly in the 45-day precipitation totals (from 28 Dec to 10 Feb) and 45-day ARI analysis, which conveys the rarity of seeing this much precipitation in the course of a month and a half (Figure 5).
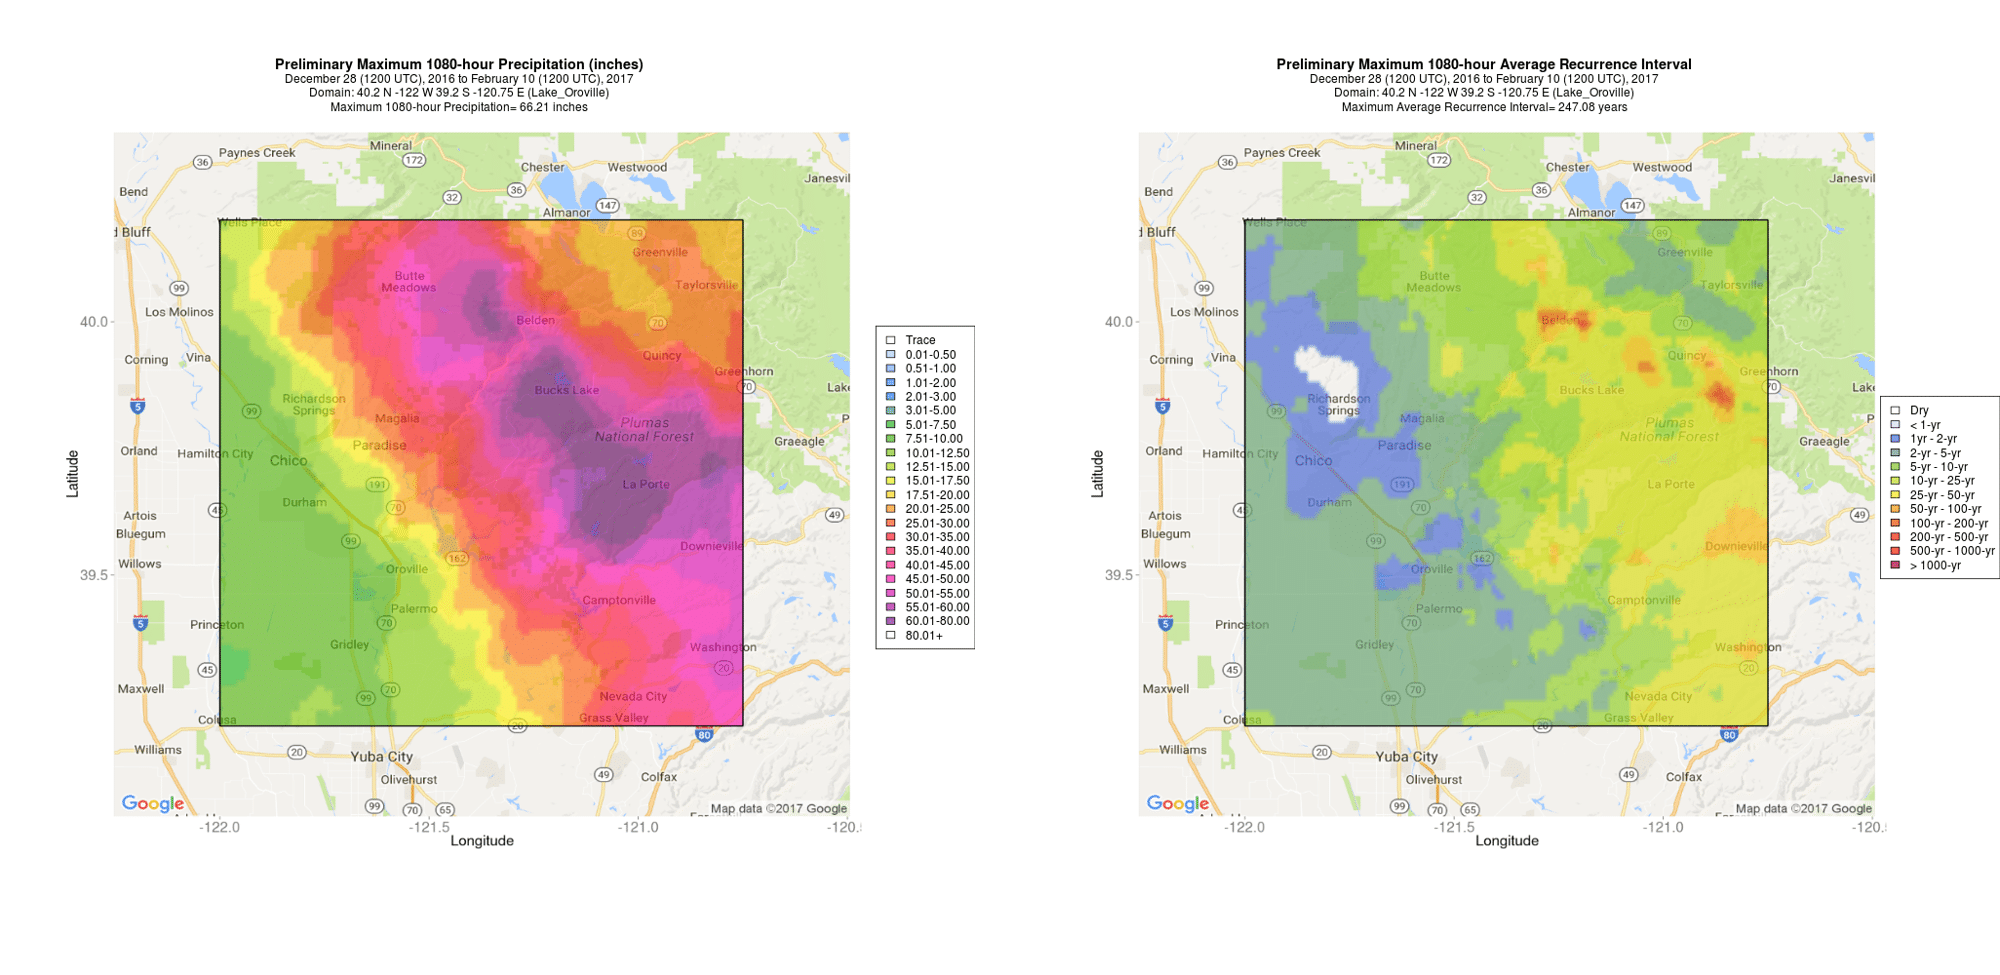
Figure 5. 45-day total precipitation (left) and and 45-day average recurrence interval (right) for the Lake Oroville drainage area.
The precipitation during this period was definitely impressive: over 20″ of liquid has fallen on all of the hilly and mountainous terrain in the region, and a substantial area upwards of 60″ of liquid is analyzed in the heart of the mountains! Such huge precipitation values are consistent with average return intervals of anywhere from 10 to 250 years in the Oroville region, underscoring the infrequent nature of such a persistently wet pattern in the Northern Sierras. It is worth reiterating that much of that high-elevation precipitation remains in the form of snow, but this highlights the issue at hand: Lake Oroville will be dealing with enormous amounts of water for months to come. In addition to gradual snowmelt over the next several months, the wet pattern looks to continue for the immediate future. The Weather Prediction Center is forecasting another 4-10″ of precipitation to fall over much of the basin in the 7 days to come (Figure 6; see also the WPC website).
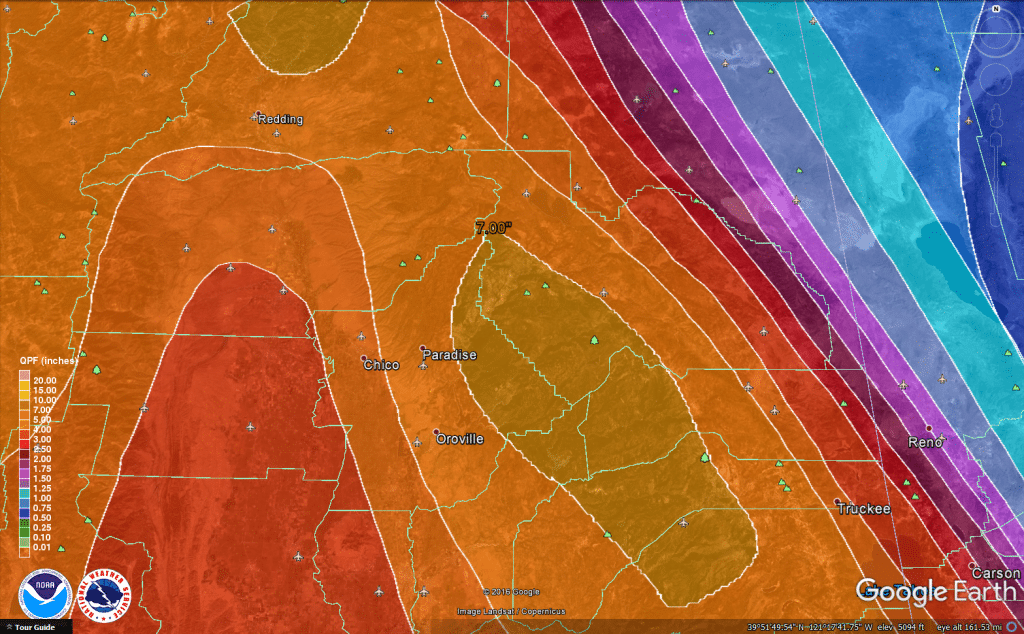
Figure 6. A Google Earth view of the WPC’s 7-day precipitation forecast, valid from 15-21 Feb 2017.
With a near-record snowpack building in the Northern Sierra Mountains and another 6-12 weeks of California’s wet season still to come, the crisis at the Lake Oroville dam will likely be ongoing for weeks. Officials are confident that the spillways can be reinforced enough to survive the season, but another extended stormy period could still be a burden and potential threat to water infrastructure all throughout the Sierra Nevada. This event emphasizes the importance of the hydrometeorological expertise that DTN provides to help design, engineer, and operate safe water infrastructure.
Data Sources:
HDSC Precipitation Frequency Grids
AHPS Precipitation Analysis
Images:
Aerial view of spillways
Lake Oroville storage
PRISM precipitation time series