


 Comprehensive weather insights help safeguard your operations and drive confident decisions to make everyday mining operations as safe and efficient as possible.
 Learn how to optimize operations with credible weather and environmental intelligence. From aviation safety to environmental compliance, our comprehensive suite of solutions delivers real-time insights, advanced forecasting, and precise monitoring capabilities.
 Hurricane Matthew: By The Numbers
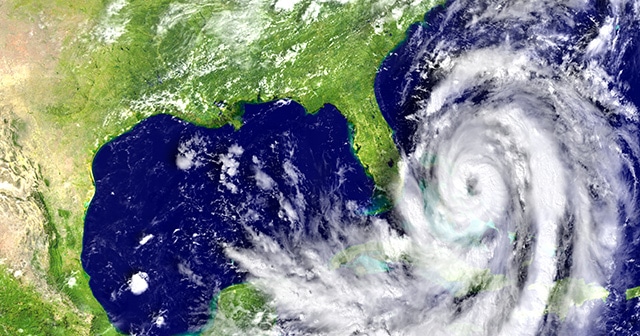
It has been over 10 years since the east coast of the United States has seen a major (category 3 or higher) hurricane hit its shores. Not since Hurricane Wilma in 2005 has a hurricane with such intensity moved ashore in the United States. Hurricane Matthew, which formed near the northern coastline of South America, became a hurricane on September 29th, and spent the next week and a half slowly churning its way up through the Caribbean and through the southeastern US before moving off into the waters of the mid-Atlantic. Indeed, the “hurricane drought” that the eastern US seaboard has experienced over the last decade has been the longest on record. Before impacting the US, the shear destruction that Matthew caused in Haiti and eastern Cuba is hard to imagine. In Haiti, over 900 people dead, on top of famine and Cholera outbreaks, has shaken an already struggling country to its core.
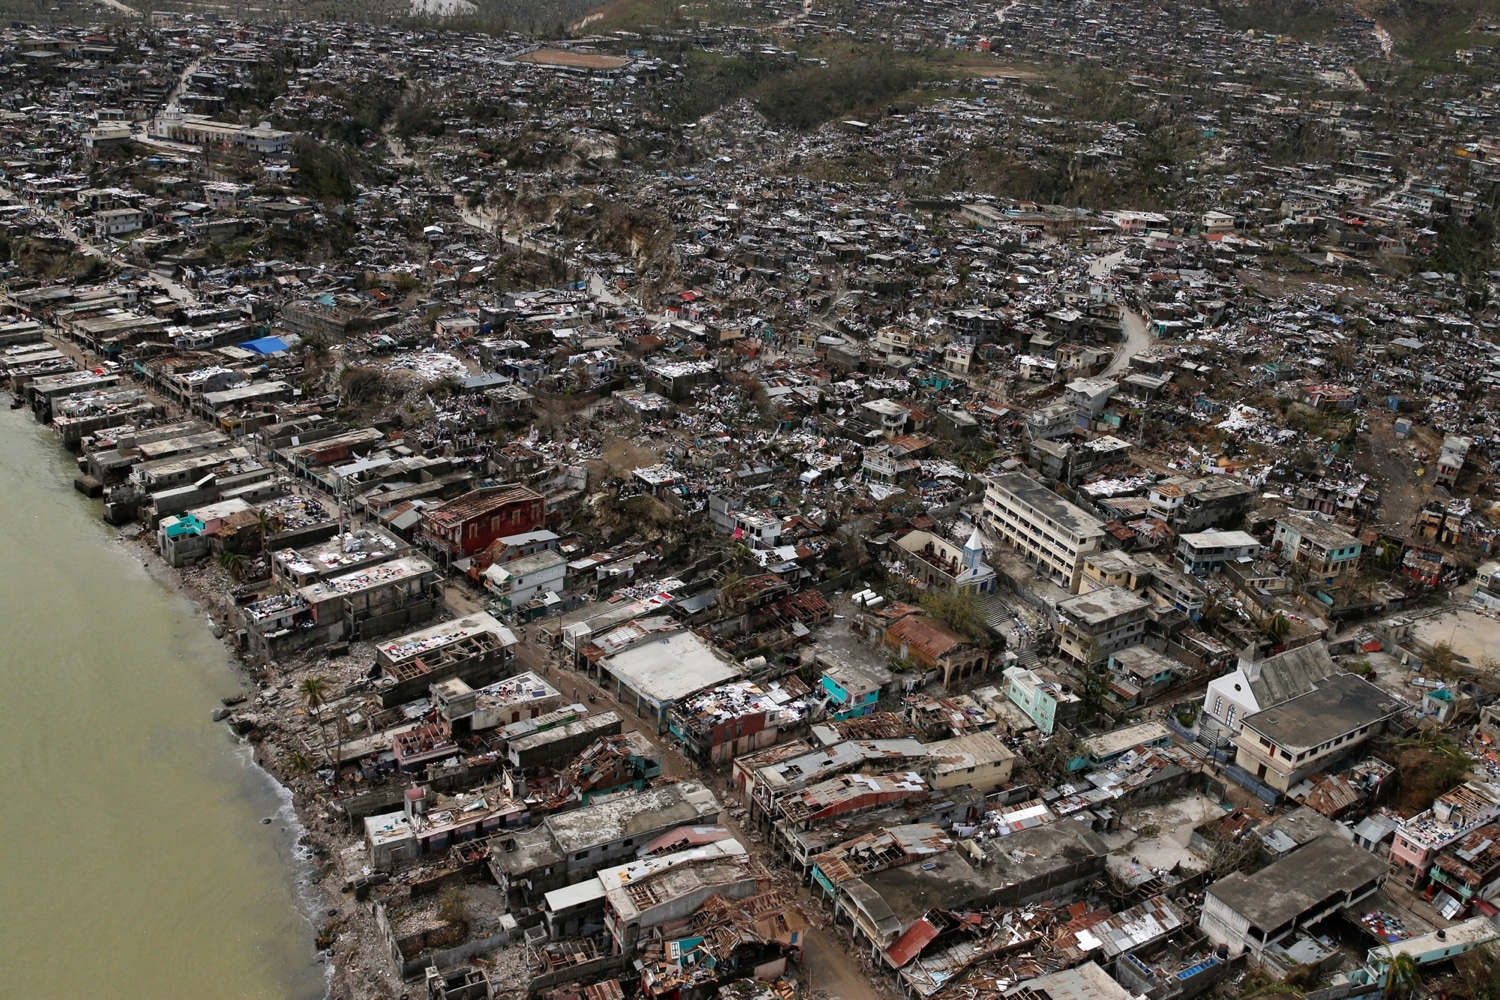
Destroyed houses are seen after Hurricane Matthew hit Jeremie, Haiti, October 6, 2016. REUTERS/Carlos Garcia Rawlins TPX IMAGES OF THE DAY – RTSR4LP
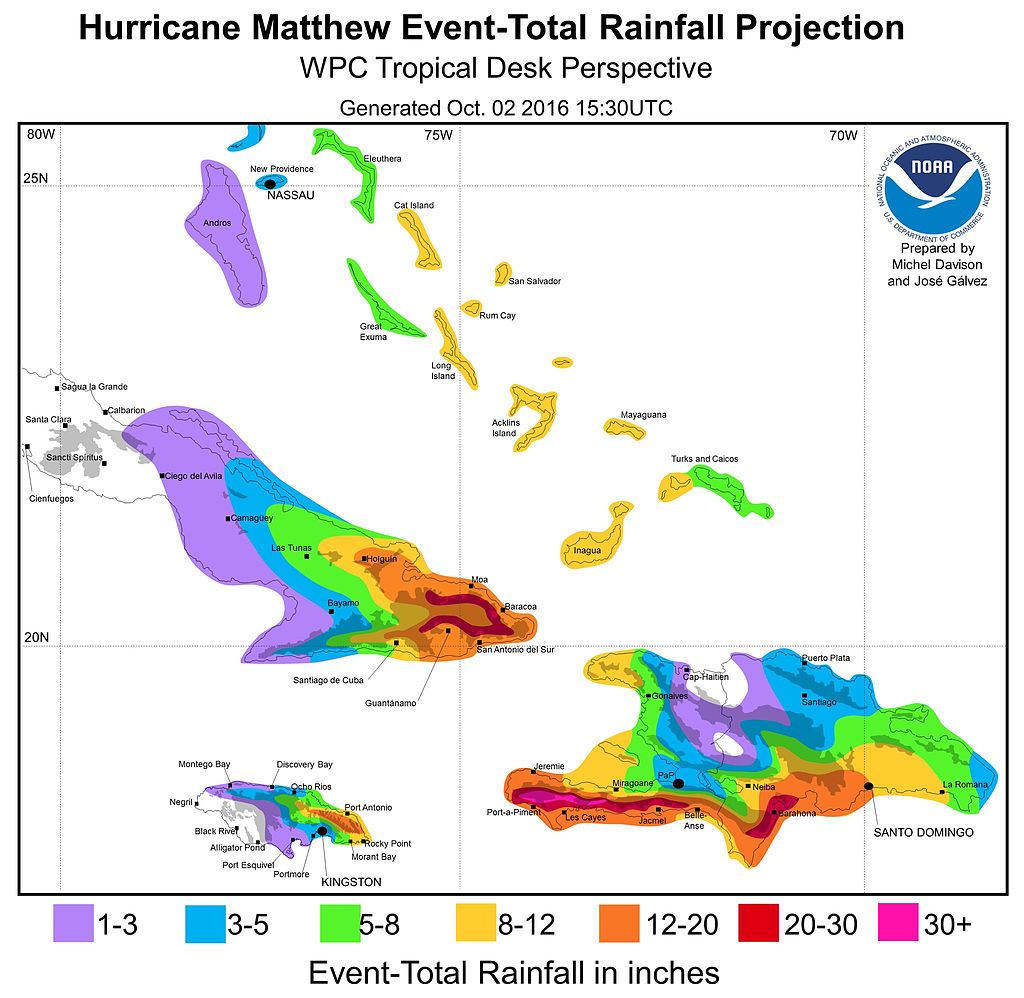
With few rain gauge networks within Haiti and Cuba, it is difficult to estimate the total amount of rainfall that fell over these countries as Matthew tore through. However, it is estimated that between 20 and 40 inches of rain hit Haiti, on top of deadly storm surges and hurricane-force winds. Despite storm surge wave heights over 25 ft, no fatalities were reported along Cuba’s shoreline communities. Moving through Haiti, Cuba, and the Bahamas Matthew weakened somewhat to a category two hurricane until it moved back out into open waters and on its was to the US coastline. Rainfall estimates in the Caribbean, via the National Atmospheric and Oceanic Administration, are shown below:
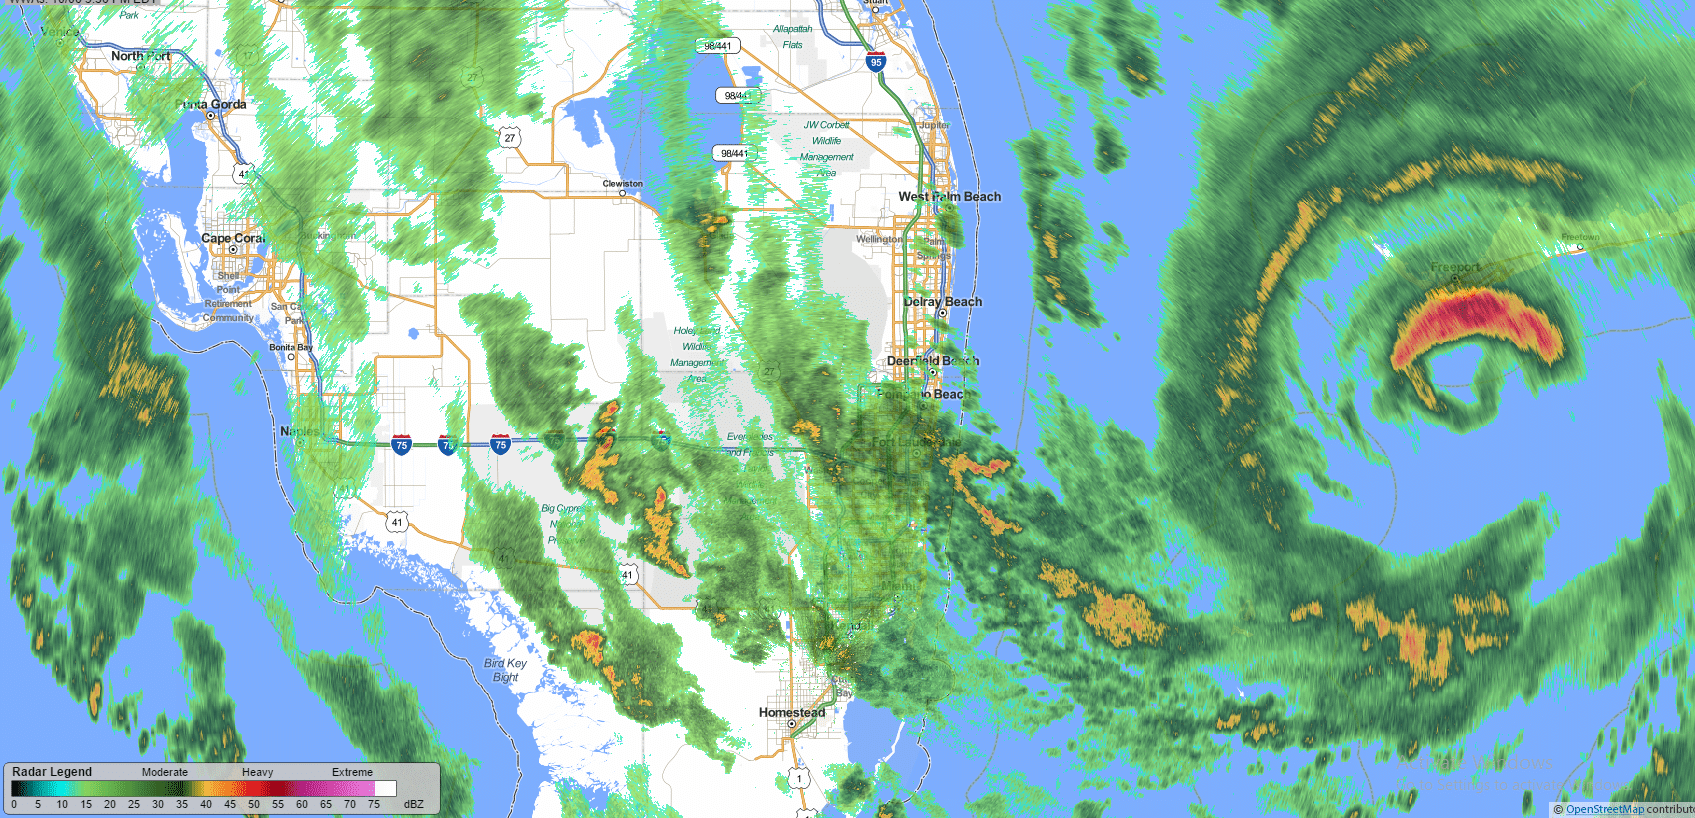
As Matthew neared Florida, it strengthened back into a category 3 (major) hurricane as it moved over a very warm sea surface. A massive complex of swirling thunderstorm bands, Matthew had both an inner and outer eye wall, stretching nearly 100 miles in diameter. The radar reflectively image below shows the shear size of Matthew as it brushed against the Florida coastline.
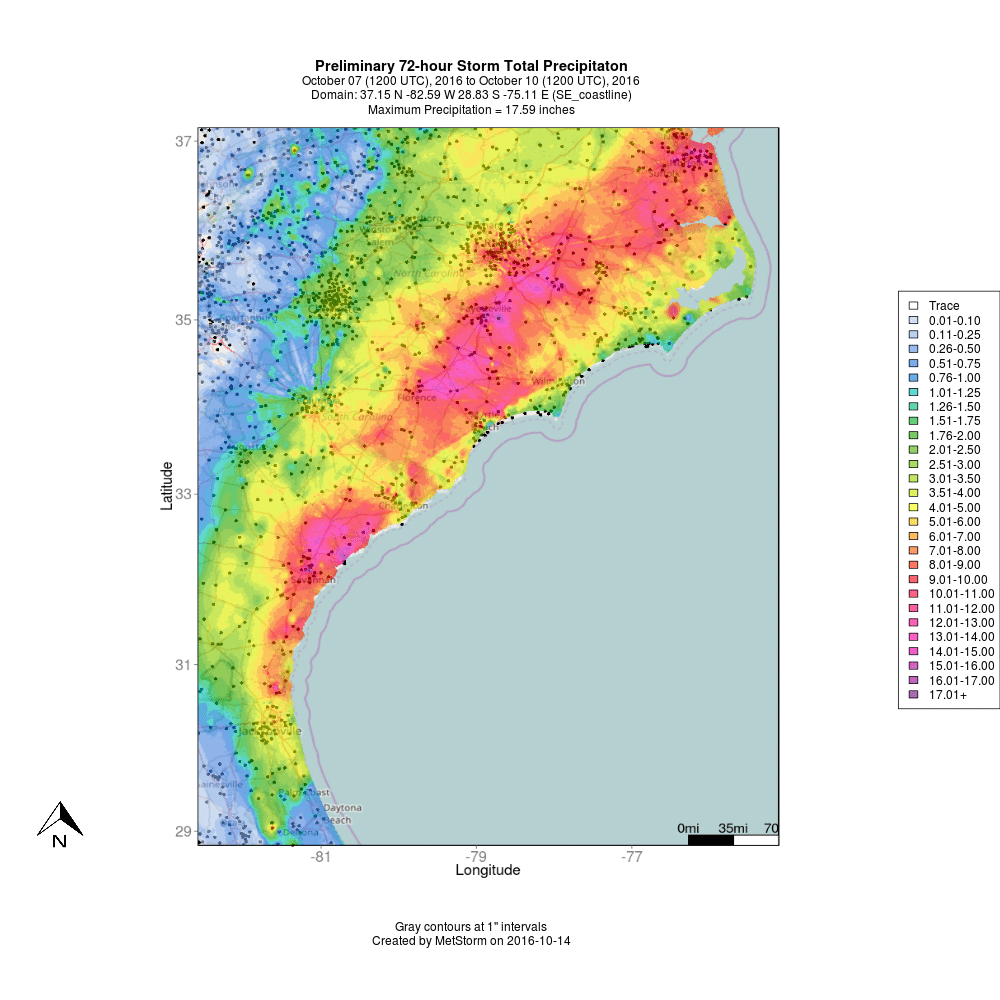
Matthew continued to spin up the east coast over the next few days, gradually losing energy and weakening. Its snail-like pace, however, meant that coastal cities saw torrential rainfall for over a day. Total precipitation for Matthew, below, shows areas with 10+” of rainfall from just north of Jacksonville, FL up to southern Virginia. The heaviest rains hit areas just north of Savannah, GA and near Fayetteville, NC.
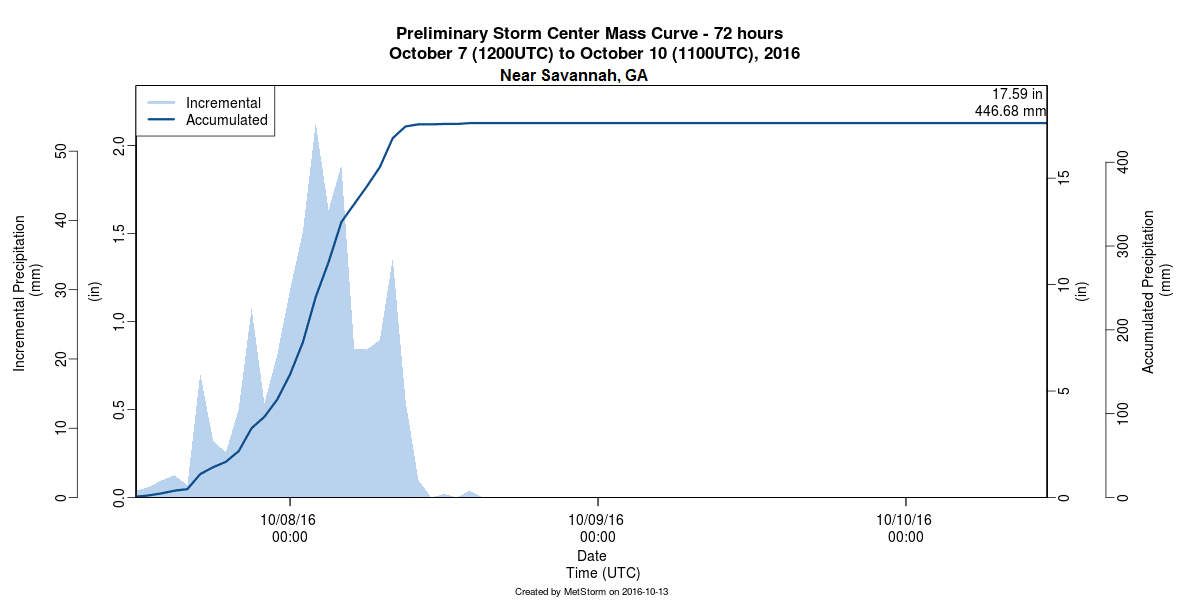
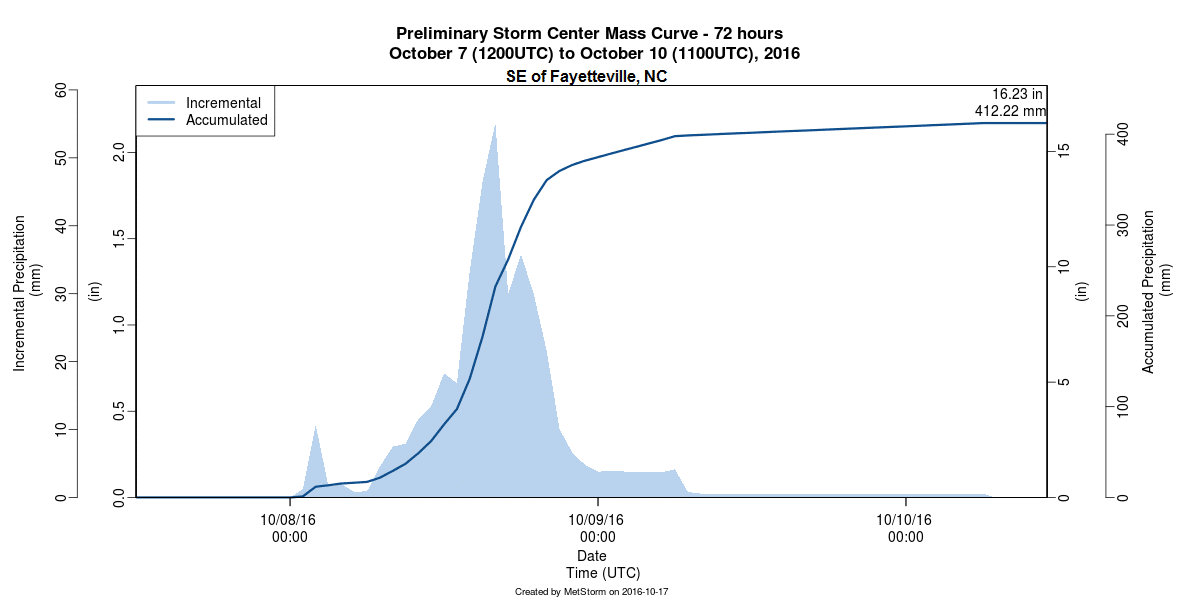
MetStorm mass curve plots for both Georgia and North Carolina are plotted below. In these images, both incremental and accumulated precipitation over the 72 hour-duration of our MetStorm run of Hurricane Matthew are shown for the latitude/longitude point of highest precipitation: near Savannah, GA and Fayetteville, NC. Note the similarities between both of these mass curve plots, with roughly a full day of heavy precipitation as Matthew’s thunderstorm bands swept up north through the east coast.
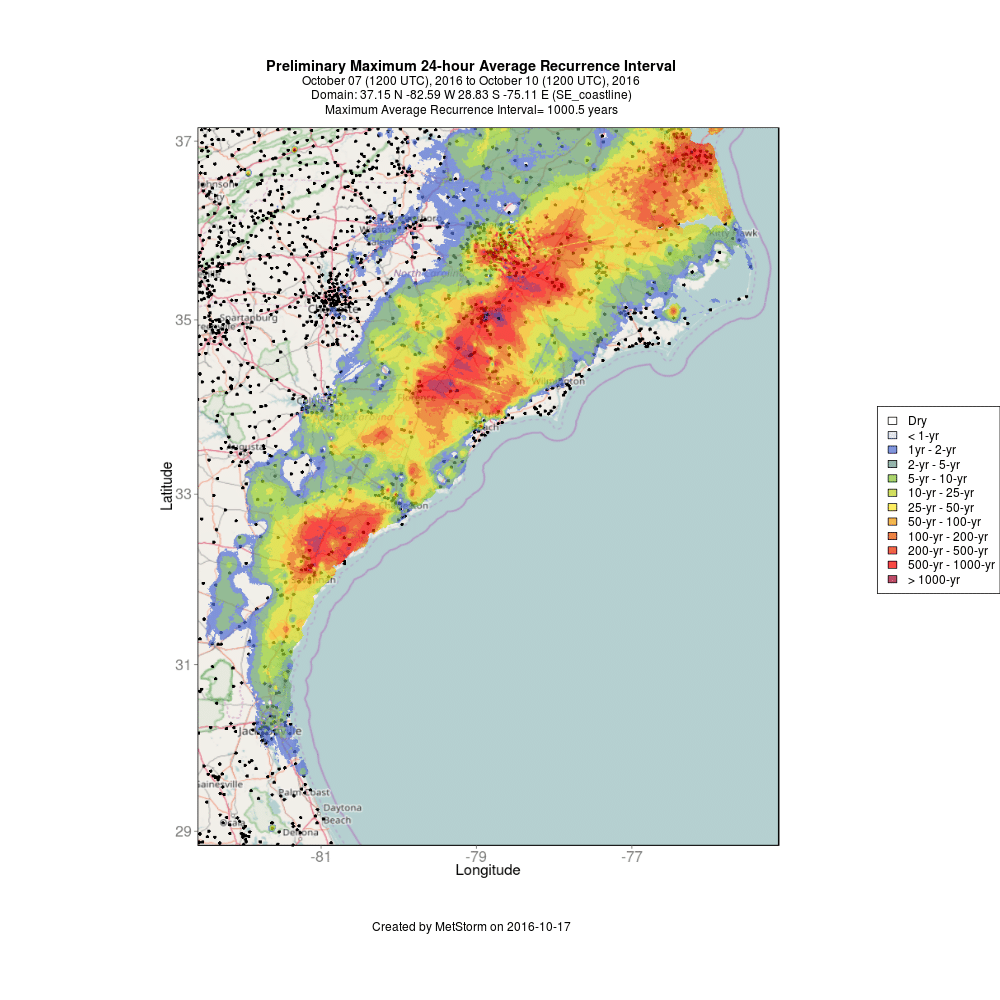
The final analysis we have performed with MetStorm is determining the average recurrence interval (ARI) for the 24 hours that the heaviest of rainfall fell in all areas of our analysis domain. The ARI is a measure of the “rarity” of a rainfall event, and so we can see that many areas received 24-hour rainfall totals that have a probability of occurring less than 1 in 500 years. Locations near the peak amount of rainfall, mentioned above, are over a one thousand-year rainfall event: exceptionally rare.
This massive amount of rainfall, coupled with very wet antecedent conditions, has of course lead to extreme flooding, especially in the Carolinas, as overflowing rivers could not contain the amount of runoff they were receiving. With a US death toll now 46 and a cost of $1.5 billion in North Carolina alone, Matthew will go down as a deadly and very costly hurricane for the east coast. Take a look at the before and after areal photos of the flooding in the Carolinas below:
Courtesy of The Weather Junkies.
This Hurricane season is proving to be a very active one. With a month and a half left in the North Atlantic Basin hurricane season, we’re hoping major storm activity veers away from the east coast.
Please note that the maps presented here are preliminary and will be updated when new data become available. If you are interested in this product, or any other product from our MetStorm Precipitation Analysis tool, please email us or send us a message though our contacts page here.