


 Comprehensive weather insights help safeguard your operations and drive confident decisions to make everyday mining operations as safe and efficient as possible.
 Learn how to optimize operations with credible weather and environmental intelligence. From aviation safety to environmental compliance, our comprehensive suite of solutions delivers real-time insights, advanced forecasting, and precise monitoring capabilities.
 1000-year Rains in South Carolina, October 2015

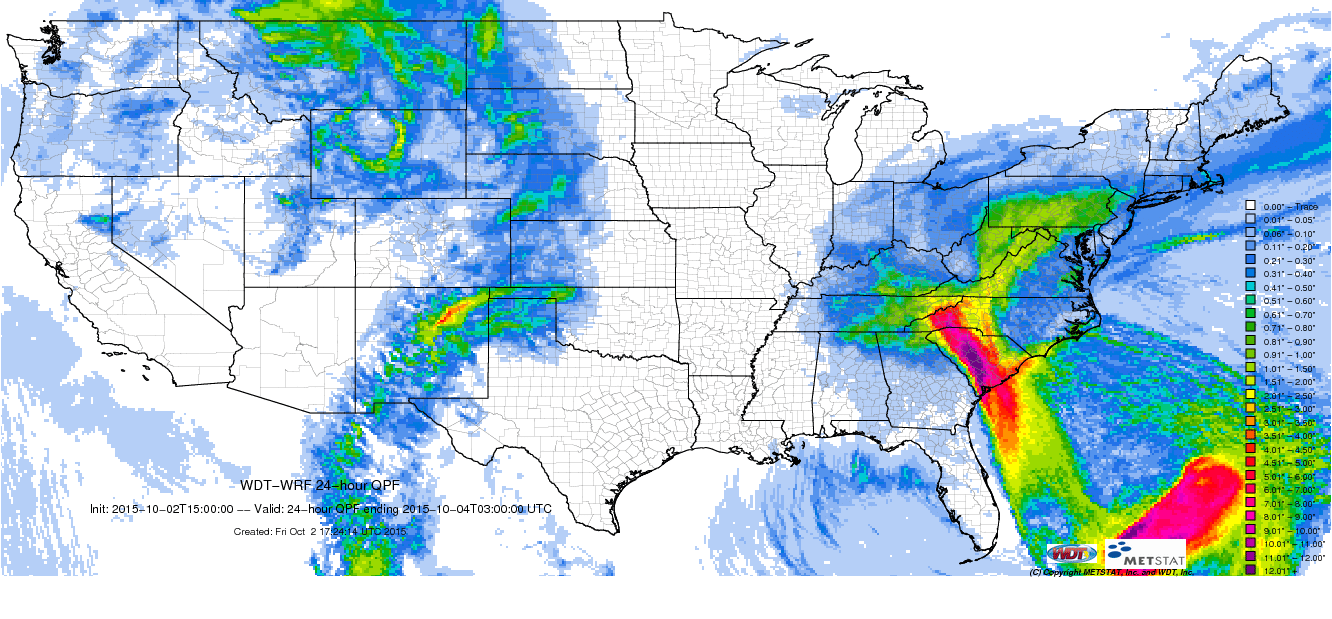
Here at MetStat, now DTN, we are continuously monitoring the situation as Hurricane Joaquin continues on its path northward. As the impacts from the precipitation of this event unfold we will be regularly updating our blog, facebook, and twitter pages with the latest information available, so check back often. Our Quantitative Precipitation Forecast (QPF) product, initialized from the 15Z (11 EDT) Weather Research and Forecasting (WRF) model run, shows significant precipitation forecasted to impact South Carolina in a 24-hour period ending at 3Z (23 EDT) this Sunday, October 4th. Shown below following the QPF map, is the Extreme Precipitation Index map, which depicts the rarity of the forecasted 24-hour precipitation ending at 3Z (23 EDT) October 4th. If the current forecast verifies, this event will be extremely rare, with a return period at over 1000-years (in other words, this event has less than a 0.1% chance of occurring in any given year). A similar QPF map of ours was featured in Dr. Jeff Masters blog about this storm. Dr. Masters post has great commentary on the meteorology and mechanisms involved in the set up and forecast of Joaquin.
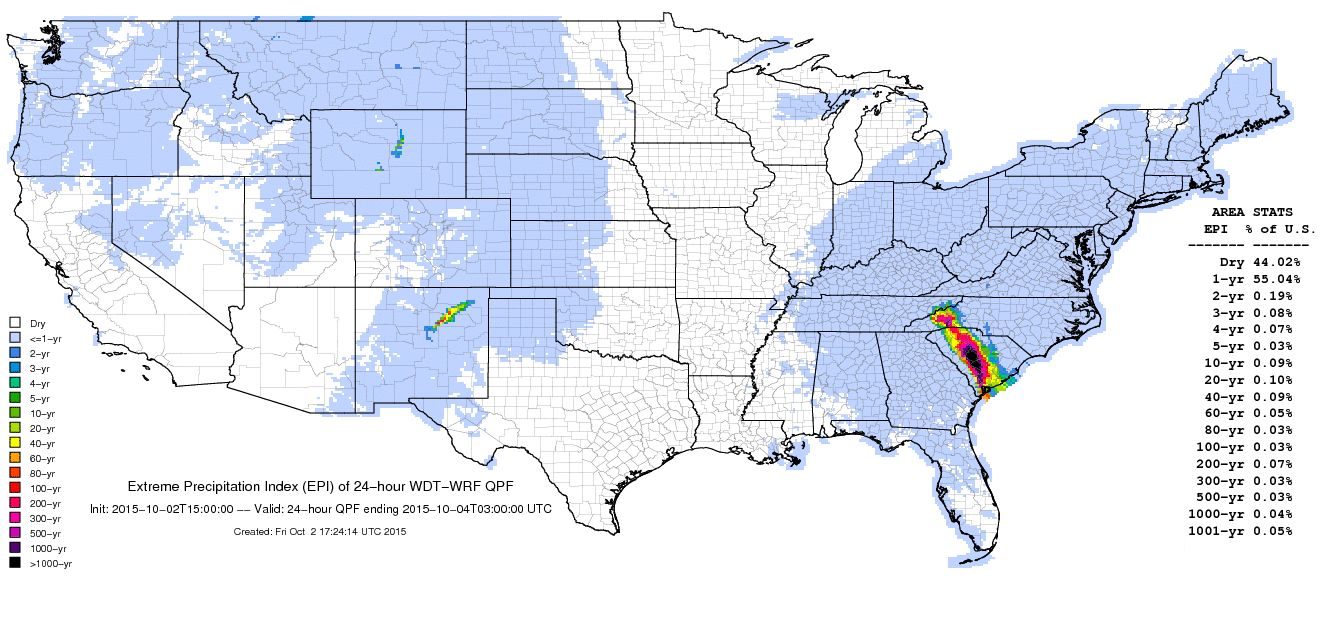
If you want to monitor the rarity of the latest 6- and 24-hour precipitation in real time, there are also live Extreme Precipitation Index analysis maps available here.
As precipitation intensifies in the Carolinas and along the east coast we will be initiating MetStorm runs, in near-real time, to keep a pulse on the amount and rarity of precipitation falling, so make sure to check back often.
Update 10/9/2015
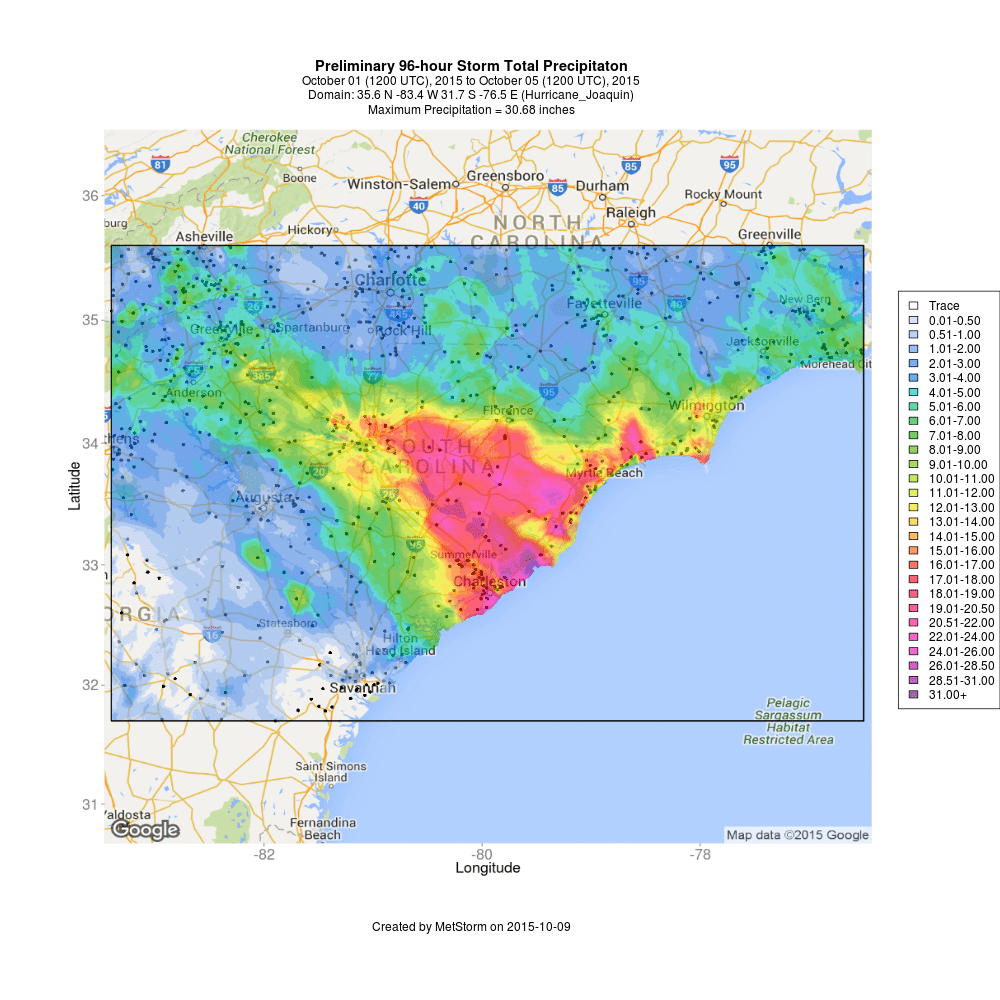
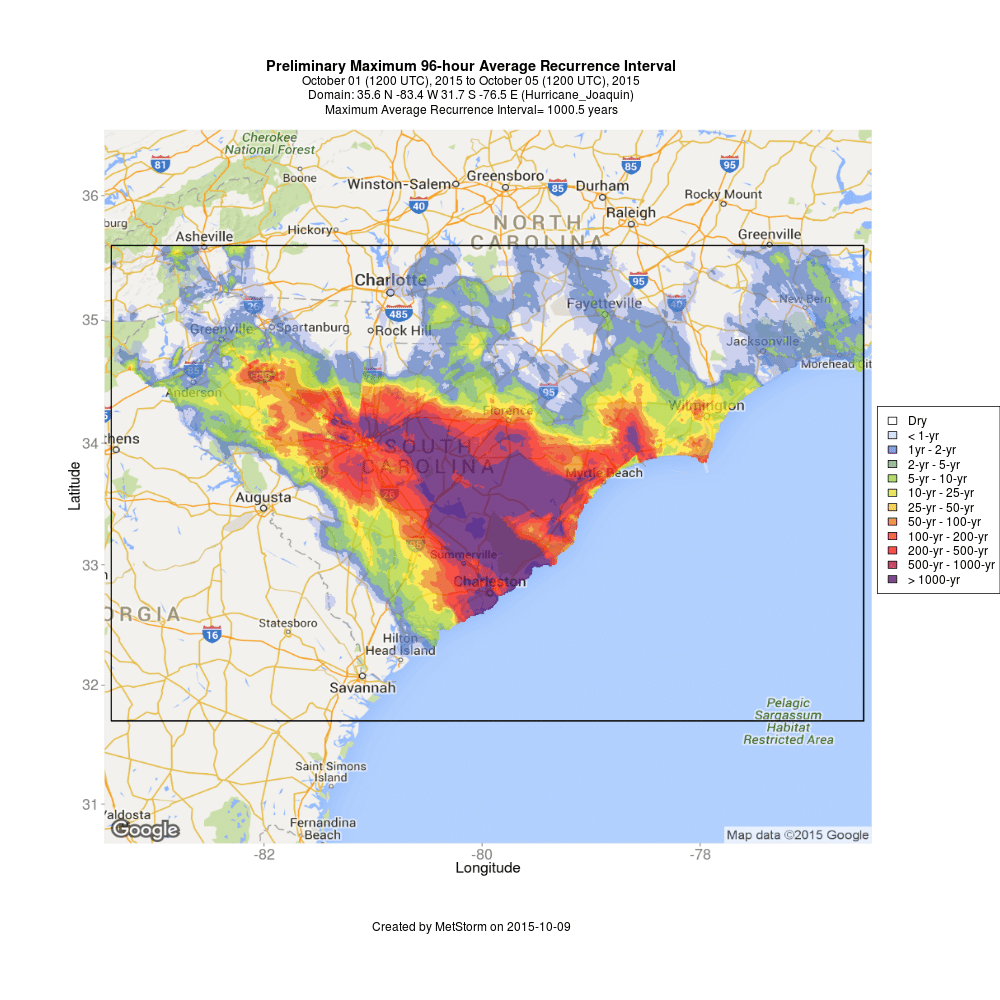
DTN is proud to share the most comprehensive rainfall and frequency analysis of the October 1-5, 2015 storm that caused catastrophic flooding in South Carolina. As forecasted, an “atmospheric river” of deep tropical moisture emanating west from Hurricane Joaquin interacted with a frontal boundary and a strong upper-level low parked over the Southeast. This produced a NW-to-SE band of extremely heavy rain that stretched across much of central South Carolina and caused 1000+ year rains. MetStat’s analysis was conducted using MetStorm™, a new, state-of-the-science hydrometeorological tool for characterizing storm precipitation. This analysis utilized dual-polarization radar mosaics from Weather Decision Technologies, satellite estimated rainfall from NOAA, 845 quality-controlled rain gauge measurements (hourly and daily) from Synoptic Data Corp and NOAA, and MetStorm’s innovative algorithms to produce high-resolution, 5-minute rainfall grids/maps. Below is a preliminary 96-hour rainfall map and corresponding Average Recurrence Interval (ARI) map. The maximum measured 96-hour rainfall was 26.88 inches at CoCoRaHS gauge MOUNT PLEASANT 6.4 NE, SC, while the highest derived rainfall was 30.68 inches along the central coast of South Carolina, just northeast of Charleston. The 96-hour ARI based on the MetStorm™ results and official precipitation frequency data from NOAA, exceeded 1,000-years (0.1% chance of occurring in any given year) across large areas of South Carolina.
Please email us for more information and other analytics (e.g. Depth-Area-Duration (DAD) plots/tables) available for this storm analysis.