


 Comprehensive weather insights help safeguard your operations and drive confident decisions to make everyday mining operations as safe and efficient as possible.
 Learn how to optimize operations with credible weather and environmental intelligence. From aviation safety to environmental compliance, our comprehensive suite of solutions delivers real-time insights, advanced forecasting, and precise monitoring capabilities.
 Hurricane Harvey – Extraordinary Flooding for Houston and Surrounding Areas
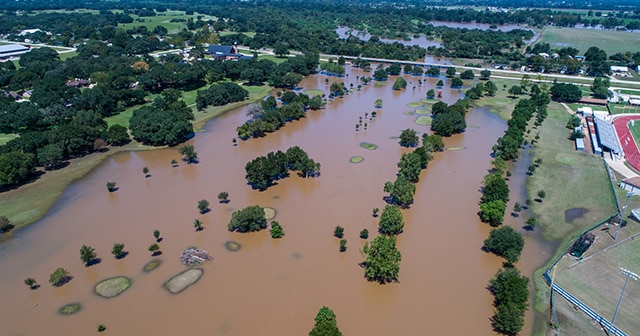
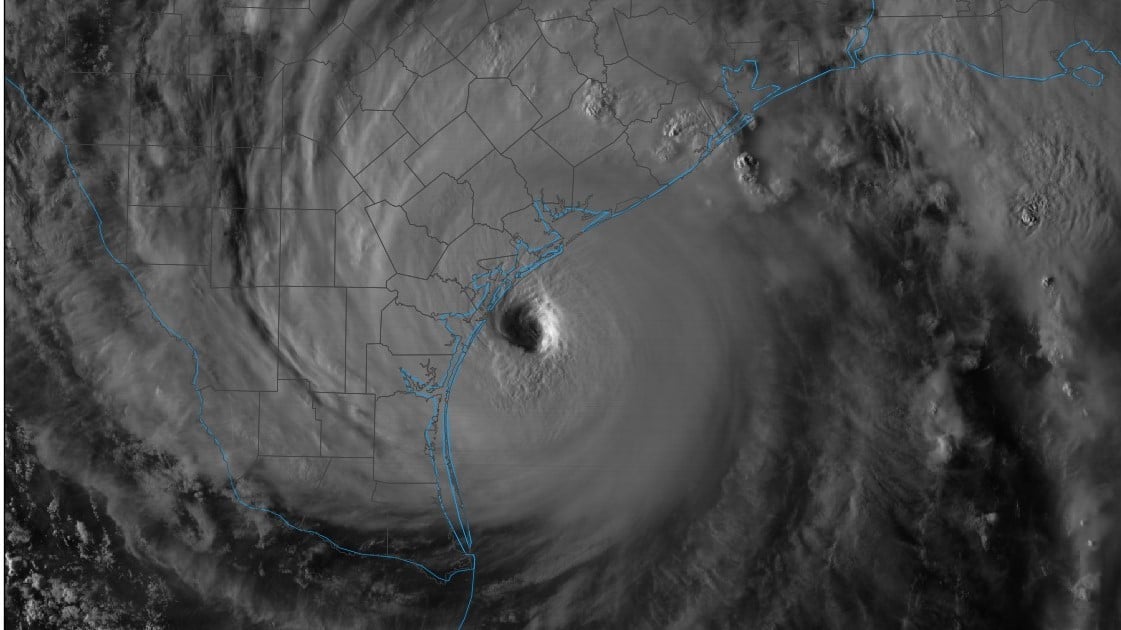
Figure 1: GOES-16 Visible Satellite Image Friday, August 25, 2017, just as Harvey, a Category 4 Hurricane, was about to make landfall.
(Image Credit: College of DuPage: http://weather.cod.edu/)
Hurricane Harvey will likely be remembered for many years as one of the most catastrophic storms to ever hit the United States. It has been nearly a decade since a major hurricane (Category 3 or higher) has hit the United States. Numerical weather models provided rainfall forecasts that where hard to believe, but largely verified over the 5th largest U.S. city, Houston, Texas.
On August 17th, 2017, what was to become Hurricane Harvey developed as a tropical wave near the Lesser Antilles islands in the Caribbean Sea. Over the course of many days, it struggled to survive as it moved westward, being pulled apart by wind shear at higher levels in the atmosphere. However, as Harvey’s remnants continued to propagate westward, the storm redeveloped into a tropical depression as it moved into the southern Gulf of Mexico on Wednesday, August 23rd. As Harvey made its way farther into the Gulf of Mexico, it intensified into a Tropical Storm by Wednesday night and signified the true beginning of Harvey. By Thursday afternoon, Harvey became a Category 1 hurricane as it moved slowly, closer to the coast of Texas. Harvey continued to intensify and by midnight Thursday, it was upgraded to a Category 2 hurricane.
Rain was already falling Friday morning over parts of southeast coastal Texas as Harvey made its slow propagation inland, getting stronger as it passed over the warm gulf waters Friday afternoon. By the time Harvey made landfall near Rockport, TX Friday evening (Figure 1), it was upgraded to a Category 4 hurricane, bringing hurricane surface winds, extremely heavy rains, and several tornadoes all along the coast of Texas. Upon making landfall, Harvey lost some of its strength and was downgraded to a tropical storm Saturday, August 26th. However, the heavy rains and severe weather continued to profoundly impact southeastern Texas and multiple locations inland for days to come. Harvey remained a Tropical Storm for many days before weakening into a tropical depression on the evening of Wednesday, August 30th.
It is very unusual for a tropical storm to remain as strong as Harvey did for as long as it did once it makes landfall. Typically, once a tropical storm makes landfall, it begins the process of dissipation due to being cut off from the rich moisture supply (warm sea surface) that originally aided in the development in the storm. This was not the case with Harvey. Due to its size, Harvey continued to fuel itself with warm water from the gulf and the abundance of water it had dropped over land, bringing copious amounts of rainfall to Houston and surrounding areas for nearly a week. The maximum recorded daily amount of precipitation occurred on Saturday, August 26th, when over 20 inches fell; at time rainfall rates of over 5 inches per hour recorded (Figures 2 and 3).
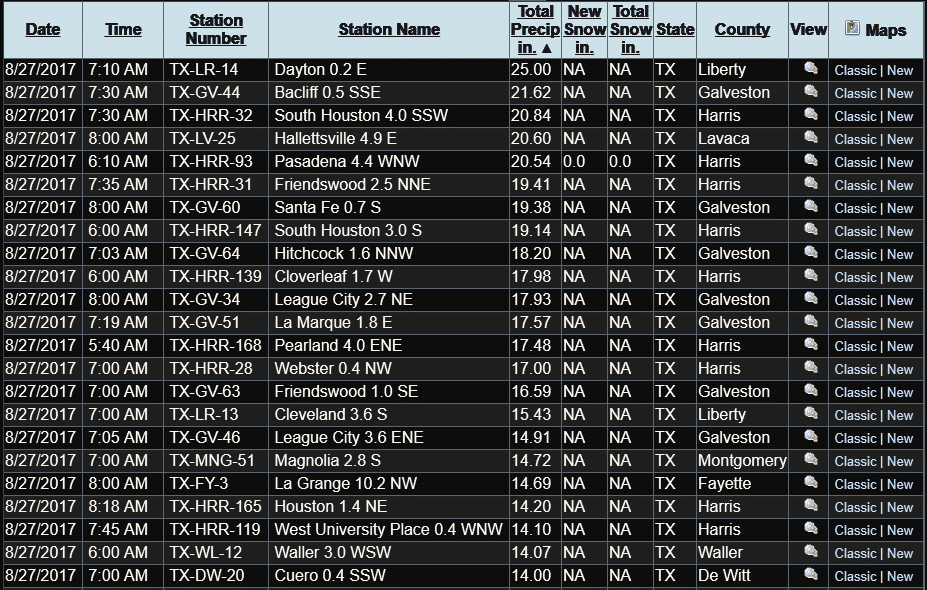
Figure 2: Daily precipitation gauge data from CoCoRaHS network, ending August 27, 2017 (https://www.cocorahs.org/)
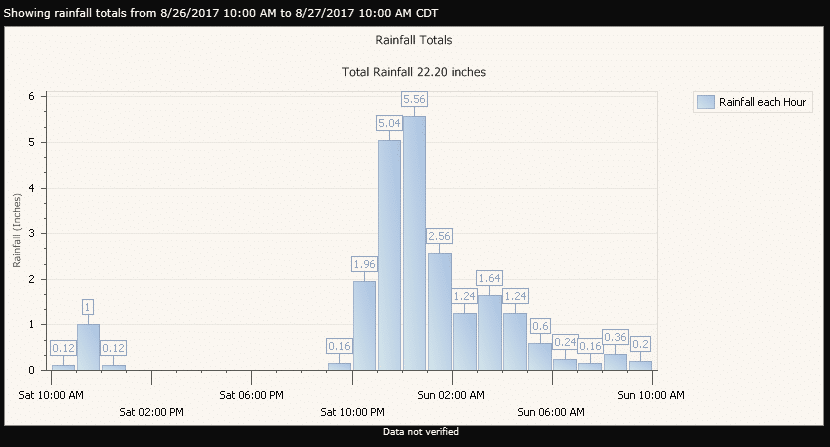
Figure 3: Hourly precipitation data measured by Harris County Rain Gauge
(https://www.harriscountyfws.org/) for August 26th, 2017 to August 27th, 2017
With the lifecycle of Harvey, an interesting atmospheric setup was present that allowed it to stay alive for so long; bringing devastation over such a widespread area. The development of two high pressure systems aloft, kept Harvey in a relatively stationary position for several days, which allowed for torrential rainfall over southeastern Texas and western Louisiana. The jet stream was located at very high latitudes, allowed for very light wind shear over Texas, and this aided in the lack of movement for Harvey. Very high precipitable water amounts, > 3.00 inches, yielding a very high moisture content to be present in the atmosphere, only added to the intense amount of rain to continue to fall over southeastern Texas and beyond. These factors allowed for Harvey to wreak havoc on Texas and Louisiana over the course of multiple days before it finally became a tropical depression on Wednesday, August 30th and dissipated in the days following as its remnants moved northeast.
Several states were affected by Harvey – not just Texas and Louisiana, albeit they were the main ones with total rainfall amounts reported by the National Weather Service reaching 51.88 inches and 22.25 inches respectively. Parts of Alabama, Arkansas, Florida, and Mississippi also felt the effects of such a large and powerful storm with total rainfall amounts reaching nearly 6.5 inches in Arkansas to more than 8 inches in Florida.
Harvey broke several records during its lifecycle, one of which was the exceedance of the maximum amount of precipitation from a Tropical Storm of 48.0 inches; beating the previous record from Tropical Storm Amelia in 1979. Figure 4 below, shows the preliminary total precipitation from August 25th to August 30th as generated by MetStat, now DTN, using MetStorm, a scientific tool for integrating radar, satellite and rain gauge data into high-resolution grids every 5-minutes. Approximately 2,000 stations were used in the MetStorm analysis, along with Dual-Pol radar-estimated precipitation data from Weather Decision Technologies. The heaviest amounts of precipitation from Harvey fell near and east of Houston.
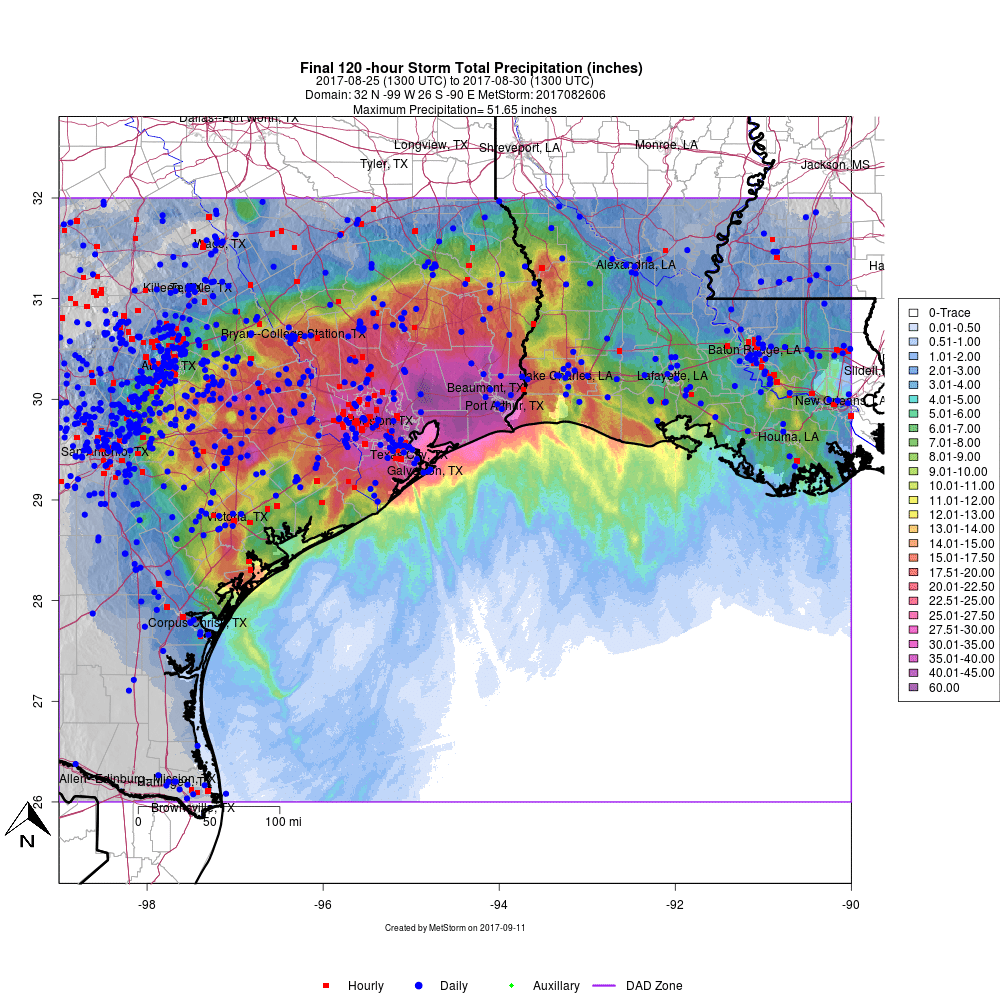
Figure 4: Storm-total precipitation across southeastern Texas and Louisiana from the morning of August 25 through the morning of August 30.
A useful way of examining just how extreme this event was is to view it from a frequency perspective using Average Recurrence Intervals (ARIs). Harvey is interesting in that for a 24-hour period, several areas experienced 24-hour rains that occur every 1,000+ years on average. However, longer duration rainfalls were even rarer; DTN examined ARIs for longer durations over the course of 72- and 120-hours using USGS Report 98-4044 (Asquith 1998) to get a handle on the true recurrence interval of this rainfall event over Houston.
Figures 5 and 6 show a 24-hour ARI and a 120-hour ARI, where the 24-hour shows a maximum recurrence interval of more than 1,000 years or a 0.1% chance of occurring in any given year, whereas the 120-hour shows localized maximum recurrence intervals of over 500,000 years or a 0.0002% chance of occurring in any given year. It should be noted that the annual exceedance probabilities (AEPs) provided in this graphic are estimated using GEV parameters from USGS Report 98-4044 (Asquith 1998). We recognize that these estimates contain considerable uncertainty, but represent the 5-day (120-hour) precipitation-frequency data publicly available at present. A more robust precipitation-frequency analysis by storm type/mechanism is required to more accurately place this event into proper historical/probabilistic perspective. However, this event did approach and exceed the Probable Maximum Precipitation (PMP), which often represents precipitation this rare from a probability perspective, at certain durations and area sizes.
It’s important to note that the probabilities for rainfall this extreme are calculated by extrapolating the distribution curves for precipitation observed over the last century and with the most current statistical approaches available. Although extremely rare, rainfall statistics of this nature are routinely computed by companies like DTN to ensure the safe operation and design of large dams and nuclear power plants, none of which failed as a result of Harvey’s rainfall.
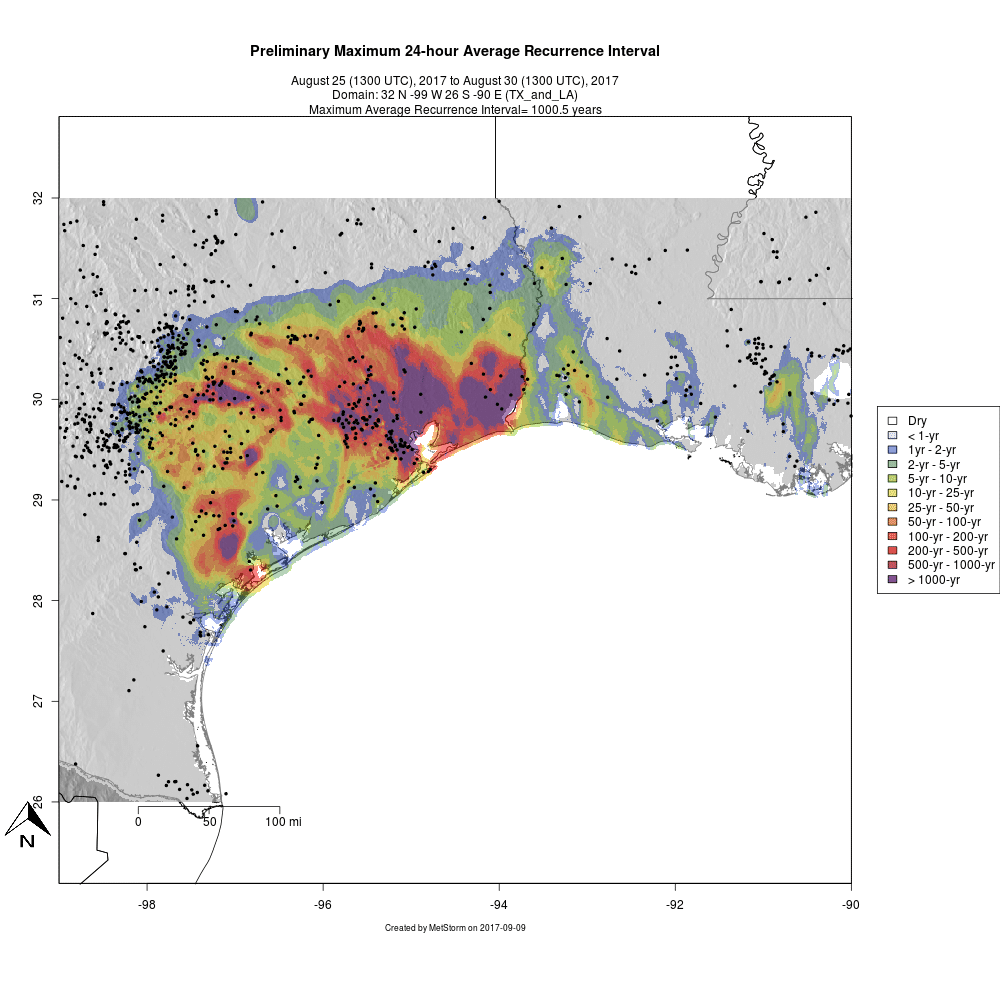
Figure 5: The Average Recurrence Interval (ARI) product for Harvey for a 24-hour Maximum ARI.
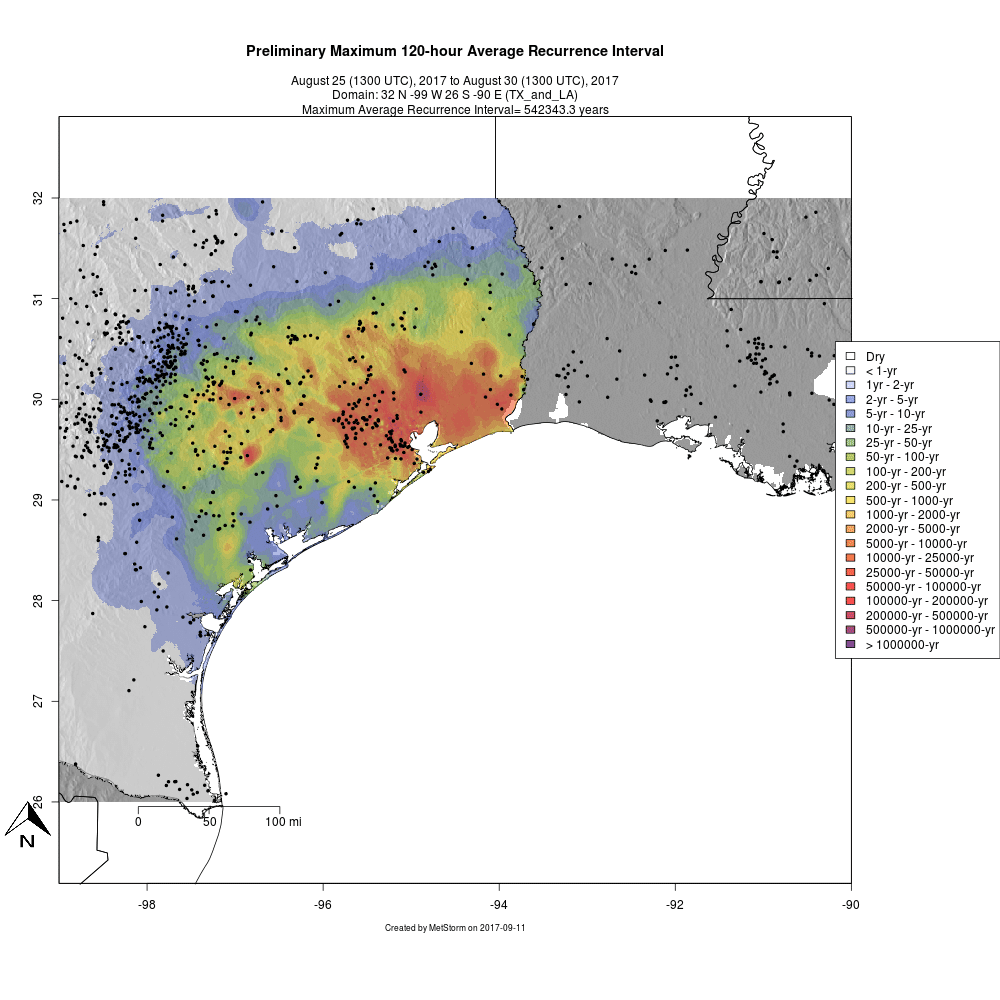
Figure 6: The Average Recurrence Interval (ARI) product for Harvey for a 120-hour Maximum ARI.
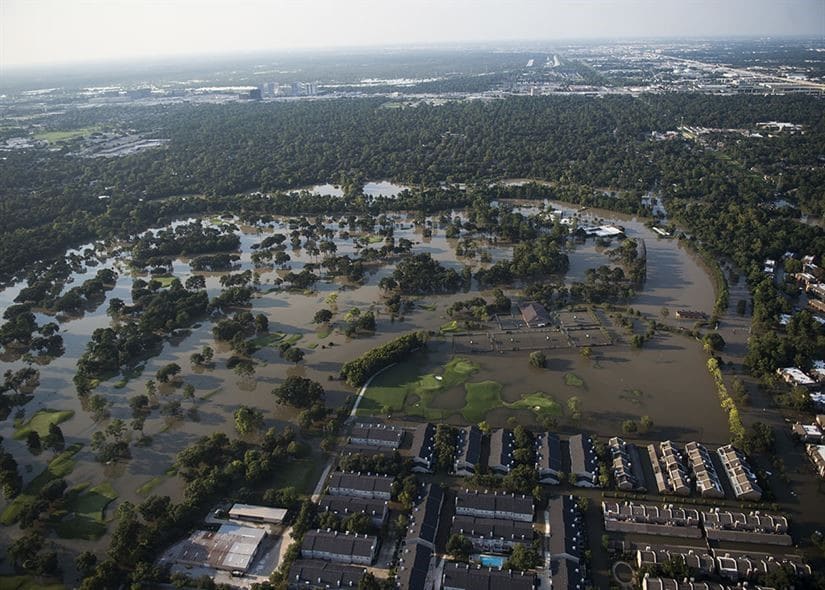
Figure 7: Areal view of Houston, TX following the aftermath of Harvey
(Image Credit: US Department of Defense, 8/31/17)
Although it has been nearly a week since the dissipation of Harvey, the aftermath will long be dealt with in Houston and surrounding areas (Figure 5). Harvey proved to be an extraordinary storm; one that will be long remembered after its time, especially with respect to extreme precipitation. For more information on other extreme precipitation events across the U.S., please continue to monitor the DTN blog or contact us.