


 Comprehensive weather insights help safeguard your operations and drive confident decisions to make everyday mining operations as safe and efficient as possible.
The Power of Weather Symbols
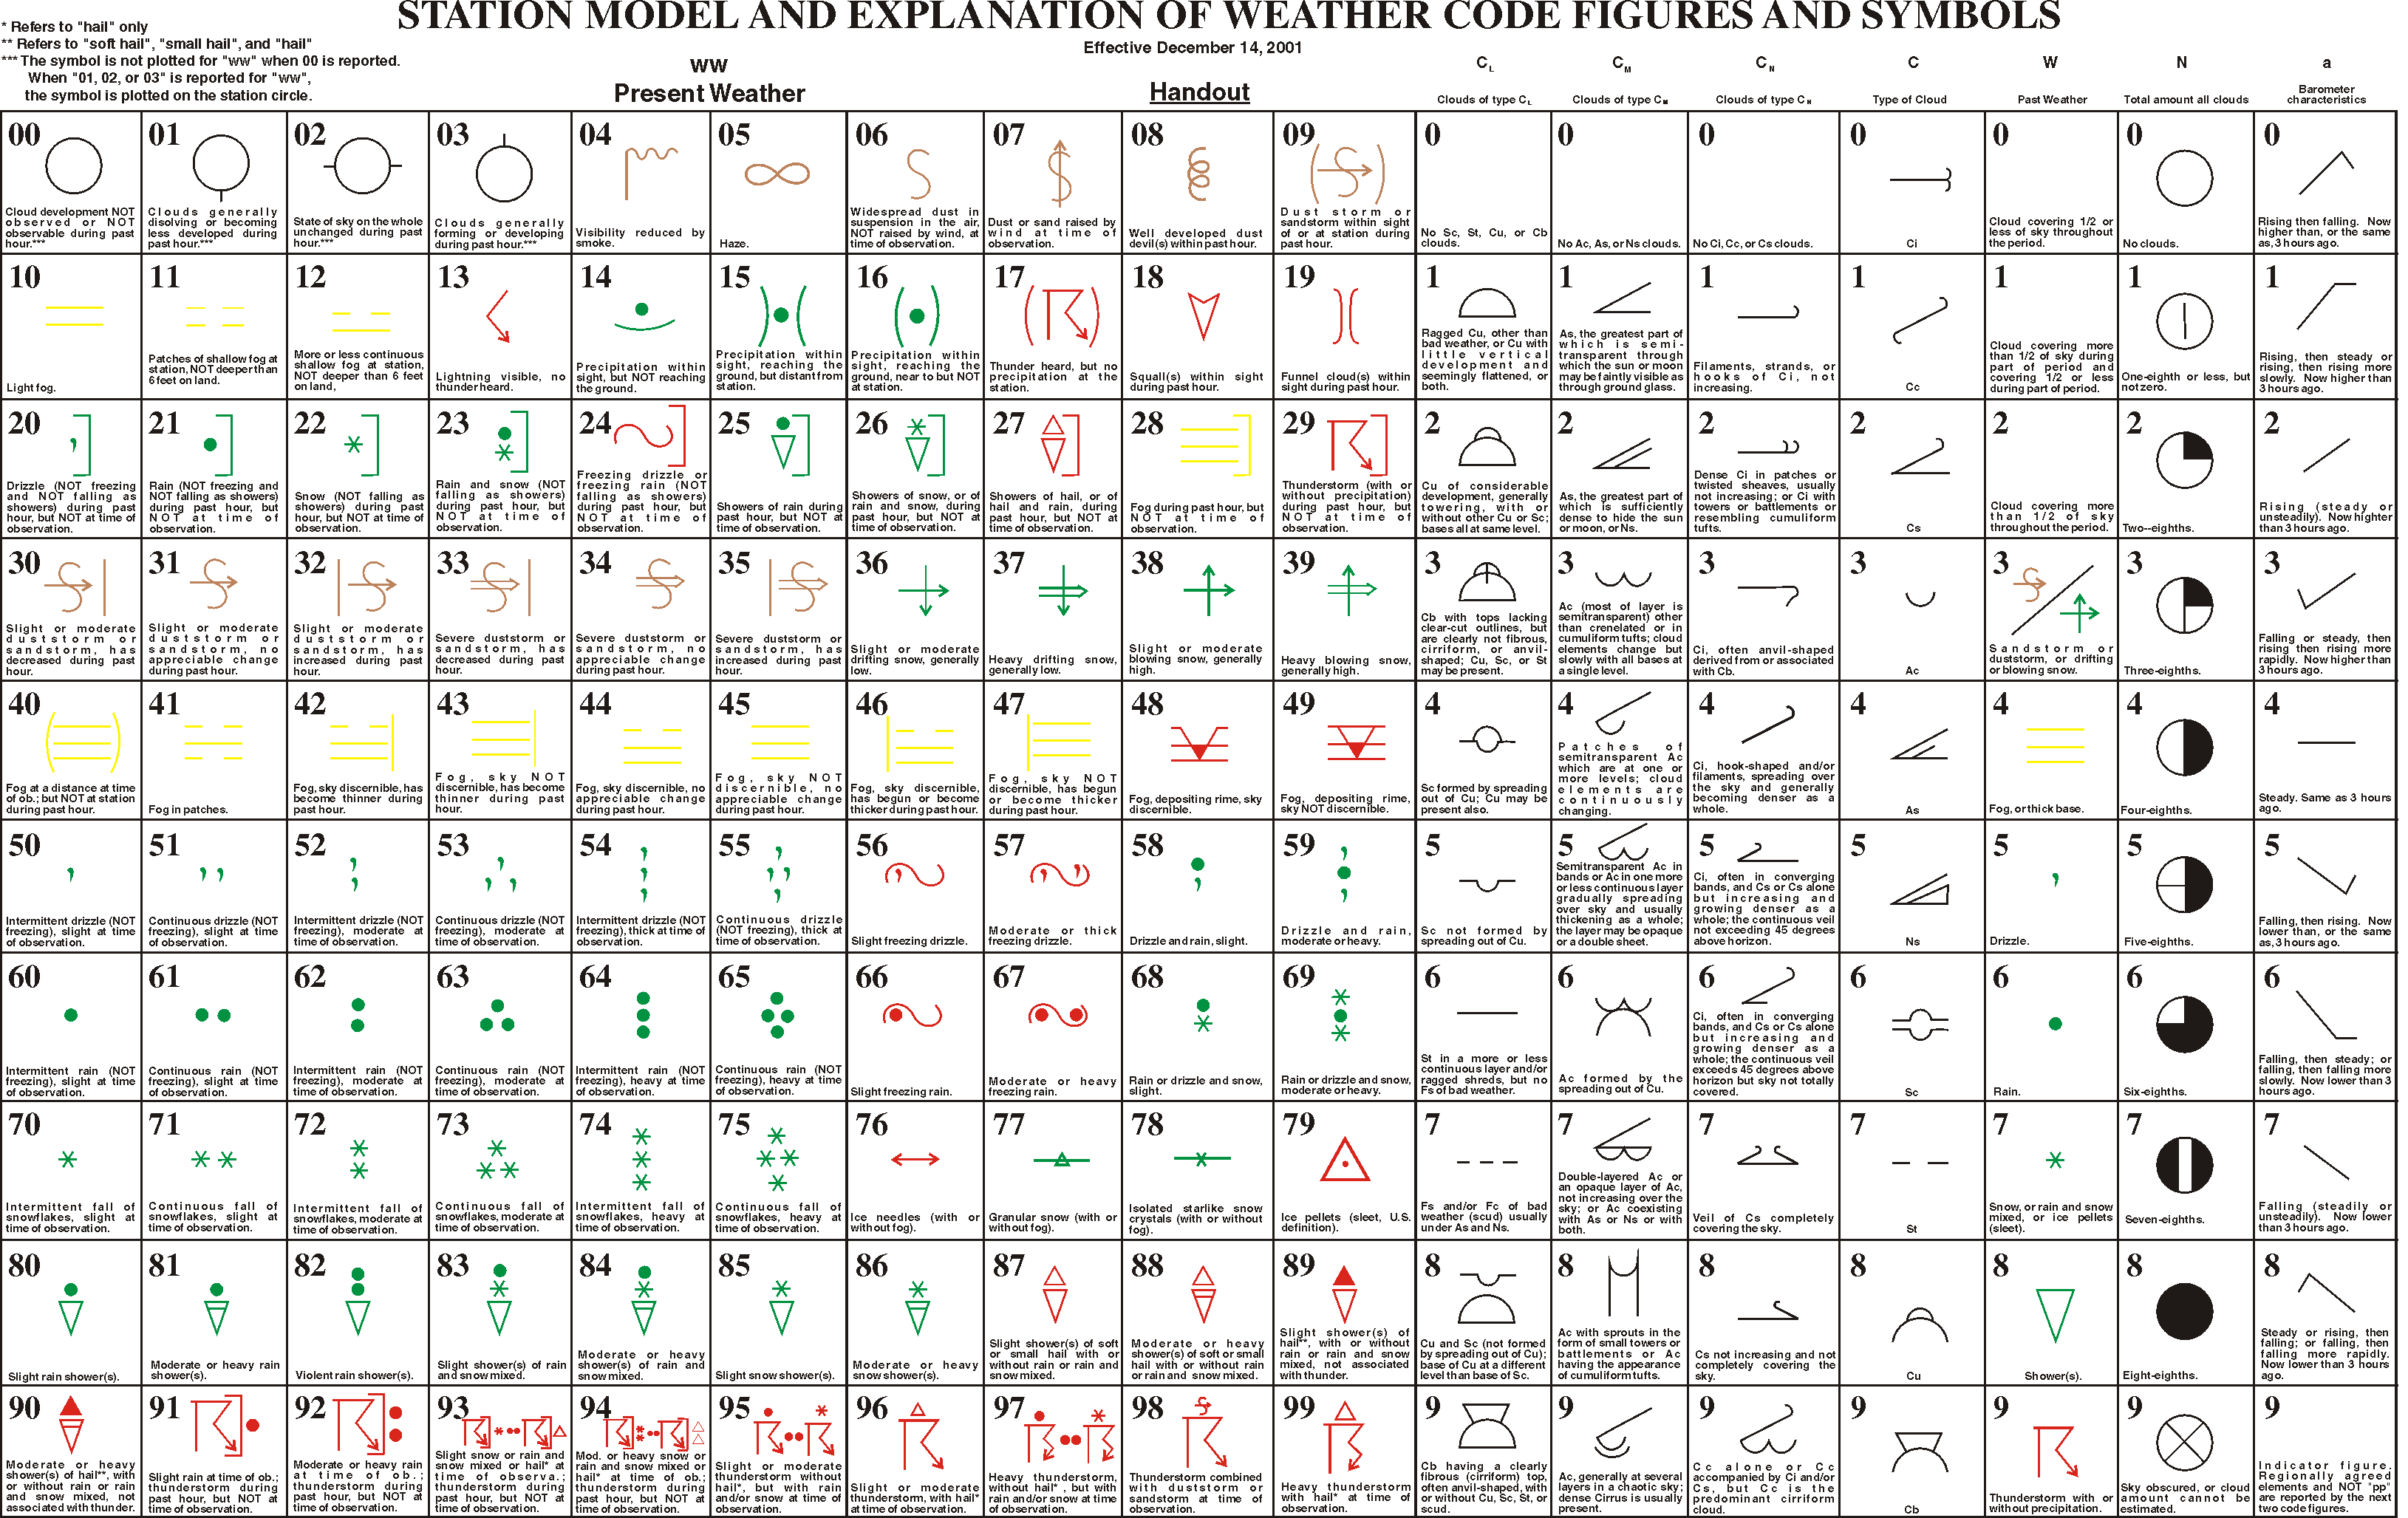
Have you ever seen a weather map and wondered what the symbols on it meant? Surface maps are great tools for getting a quick look at weather conditions. They allow meteorologists to gain a wealth of information about the weather at a glance by viewing the various symbols.
The origin of some weather symbols, such as those for thunderstorms, can be traced back as far as the 1870s. During this period, weather observations were able to be transmitted across telegraphs. The War Department began issuing weather maps a few times a day in the 1870s that presented current conditions. Eventually, other countries started working together on how to standardize weather observations. In 1872, a committee was formed to develop a standardized procedure for presenting weather conditions. Their goal was to create a system that could be understood regardless of the language spoken. Symbols were adopted from several countries including France, Russia, and Austria. A standard set of symbols, shown below, was agreed upon in 1891.
 Click on Image to Enlarge
Weather symbols can represent a wide variety of conditions such as fog, snow, and rain. These symbols can indicate what is being observed along with the intensity. For instance, a single dot represents rain, but multiple dots convey how heavy the rain is falling at the time.
Surface maps can provide a wealth of information on current conditions outside. The advantage of using these symbols is that they can quickly be used to get a sense of the weather being observed over a large area. When making a forecast, meteorologists need to see what type of weather is occurring at many locations. Understanding what these symbols mean can help you to know what kind of weather is approaching your area.