


 Comprehensive weather insights help safeguard your operations and drive confident decisions to make everyday mining operations as safe and efficient as possible.
 Learn how to optimize operations with credible weather and environmental intelligence. From aviation safety to environmental compliance, our comprehensive suite of solutions delivers real-time insights, advanced forecasting, and precise monitoring capabilities.
 Looking Back At Winter 2020
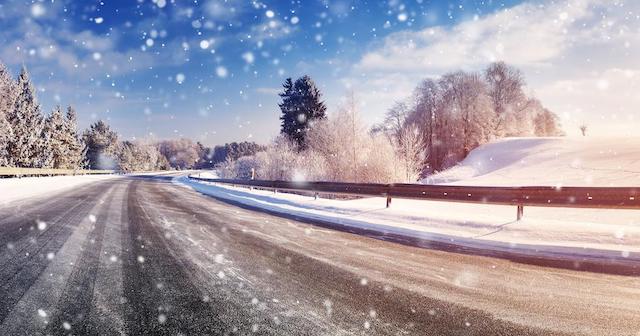
As we wrap up the winter season and start enjoying the warmer weather, let’s take a look back at this winter and how it lived up to expectations
After a brutal winter for the Northern Plains back in 2018/2019, we were all hoping for a winter with less snow and cold. Going into November and December, we were looking at a mainly neutral year for the El Niño-Southern Oscillation (ENSO) index. This generally means colder-than-average temperatures in the midwest and northeast, to warmer and wetter than average in the southeast.
How did the early winter compare with an ENSO neutral winter?
November started off with characteristics of an ENSO neutral winter, with colder-than-average temperature in the Great Lakes and northeast regions. The southeast also saw above-normal precipitation along with the Northern High Plains, which isn’t totally unusual for an ENSO neutral winter. When December hit, the forecast started to spiral out of control, with almost the entire country seeing above-normal temperatures. Many areas of the country recorded above-normal precipitation, including the Northern Plains, High Plains, southeast, southwest and New England. The only regions drier than normal in December were the south-central and Pacific northwest.
The mid-winter update predictions
At the mid-winter update, we were expecting warmer-than-normal temperatures in the southwest and colder-than-normal temperatures in the Central Plains and Great Lakes. Precipitation wise, we were expecting the southeast to see higher-than-normal precipitation in January and February. The Ohio River Valley and lower Great Lakes were expecting drier-than-normal conditions going into January but shifting to wetter than normal for February. Our prediction for western US was drier than average for much of the late winter months.
The Bottom Line
Putting December, January and February together, we ended up with an overall warm winter for the entire country, with above-average temperatures dominating most of the winter, which can be seen in figure 1. The regions with the most above-normal temperatures were the lower Great Lakes, southeast and along the entire Eastern Shoreboard. Areas like California and Washington also saw mainly above-normal temps this winter. The well-above-normal temperatures ended up busting our mid-winter forecast as we were expecting below-normal temperatures.
Average precipitation across the county for the three winter months (figure 2) actually followed pretty close to an ENSO neutral winter and verified our mid-winter forecast with above-normal precipitation in the southeast, with near-normal precipitation elsewhere. There were some dry periods this winter for areas like the upper midwest, but they averaged out with heavier precipitation in December.
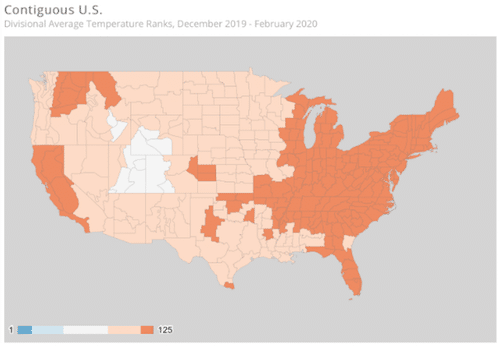
Figure 1: Average temperature ranks above and below normal for December-February. Red colors represent temperature on average were warmer than normal. White colors represent temperatures on average were at or near normal. Blue colors represent temperatures on average were colder than normal.
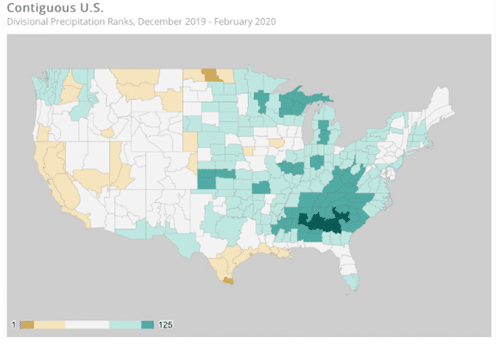
Figure 2: Average precipitation ranks above and below normal for December-February. Green colors represent higher than normal precipitation. White colors represent at or near-normal precipitation. Brown/yellow colors represent lower-than-normal precipitation.
https://www.ncdc.noaa.gov/cag/divisional/mapping/110/tavg/202001/3/rank