


 Comprehensive weather insights help safeguard your operations and drive confident decisions to make everyday mining operations as safe and efficient as possible.
 Learn how to optimize operations with credible weather and environmental intelligence. From aviation safety to environmental compliance, our comprehensive suite of solutions delivers real-time insights, advanced forecasting, and precise monitoring capabilities.
 Gauging gasoline demand in a COVID-19 world

Getting gasoline where it needs to be and pricing those gallons to move fuel and turn a profit has always been a challenging endeavor. In today’s scarred COVID-19 world, those challenges have multiplied, upending traditional practices, including how to determine the factors in fixing term contracts in the wholesale market, whether you are a buyer or seller.
Leaning on historical demand patterns to formulate a baseline in your assumption of needed supply won’t work in a world that is contending with a pandemic, prompting government-forced business shutdowns and mobility restrictions. Consider, too, the effect of behavioral changes spurred by safety concerns during the pandemic and what traits might be long-lived regarding work commutes, business travel, and family getaways.
Historically, the labor market’s health has closely correlated with driving demand, falling when unemployment increased since fewer individuals were making the commute to work. The number of unemployed in the United States reached a modern-day high in April 2020, at 23.109 million, notes the Federal Reserve Bank of St. Louis in their FRED series of macroeconomic data points. In reviewing 30 years of data from the Energy Information Administration (EIA), gasoline demand in the United States fell to its lowest point at 5.065 million bpd during the week ending April 3, 2020 — down 48% against the year prior. This was no coincidence.
Employment improved markedly over the next several months, with the number of unemployed sliding to 10.1 million in January 2021, according to the Bureau of Labor Statistics. That trend will continue as accelerating vaccination programs inoculate millions more, advancing towards herd immunity — the point when enough people have become immune to the infection that there is no longer an epidemic. The United States could reach that point during the second half of 2021.
Yet, structural change has occurred, and getting back to the 20-year low in the number of unemployed individuals achieved in February 2020 at 5.717 million is unlikely for years. This is true despite complaints from manufacturing companies of a lack of workers at all skill levels, compounded by a shortage of skilled workers for home construction and the healthcare industry.
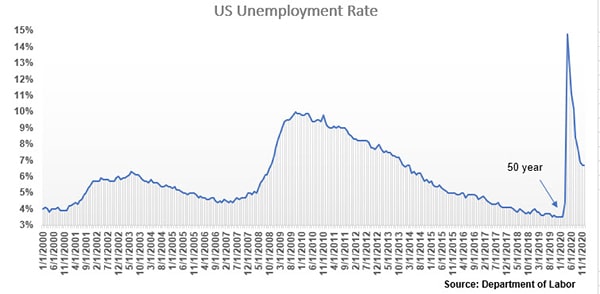
The U.S. unemployment rate over the last 20 years. Note the 50-year low and the COVID-19 related spike immediately following.
During the pandemic, the demand for baristas has shrunk while the drive to automate certain kinds of jobs accelerated, such as factory line work. Remote work has been a savior for the U.S. economy, and claims of widespread productivity gains suggest, too, this is an enduring trend — even if in a hybrid environment where an employee commutes to the office two or three days a week as opposed to the traditional five.
These are destructive developments for gasoline demand, which likely peaked annually in the United States in 2019, at 9.31 million bpd. EIA projects gasoline consumption at 8.69 million bpd this year.
There’s another part to the story. The pandemic and violent riots in urban centers have triggered a mass exodus from large cities, coast-to-coast. According to the U.S. Census Bureau, sixteen states lost residents in 2020 compared with 2019, while the U.S. population increased 1.154 million or 0.4% to 329.5 million over the year. States with the highest loss of population include New York, down 126,355 or 0.7%; Illinois, down 79,487 or 0.6%; and California, down 69,532 or 0.2%.
Many jobs in city centers are likely permanently lost, but the move to smaller cities, suburbs, and rural areas creates pockets of demand elsewhere. And for those that continue to commute, a passenger vehicle might feel more secure than mass transit. After plunging in March and April 2020, amid lockdowns, light-vehicle sales have steadily increased, totaling an annual rate of 16.6 million in January 2021, compared with 8.7 million annualized in April 2020.
So where are people moving? The top three states where population levels grew annually in 2020 include Texas, up 373,965 or 1.3%; Florida, up 241,256 or 1.1%; and Arizona, up 129,558 or 1.7%.
The sound advice of knowing your market might now evolve into relearning your market. A starting point is crucial, so chart the three-year history of demand and rack pricing for your markets, and then take out your red pen; a Sharpie if you prefer. Ask, how does my state’s current unemployment rate compare with last year, two years ago, and five years ago? Is my region growing economically, and if so, what new businesses are being created? Or, is there attrition? Where do I need to lower my ratable volume?
Be seasonally strategic. Families swamped outdoor vacation spots during the summer of 2020, with the Recreational Vehicle Industry Association reporting an 11% jump in recreational vehicle sales in June 2020, estimating a 4.5% increase in RV sales in 2020, despite losing three months due to closed showrooms amid government lockdowns. It’s a good bet outdoor vacations will figure prominently into many family to-do lists this summer. As an increasing number of vaccines are administered, and larger groups of individuals feel safer, traditional vacations will reemerge as well.
Historically, discretionary spending has been another barometer in gauging driving demand, as confident consumers are willing to spend and drive more. On that front, 2020 ended in disappointment as retail sales during the usually busy holiday season were weak, down 0.7% in December after a 1.4% decline in November, according to the Census Bureau.
Based on the Labor Department’s nonfarm payroll report, the weakness continued into January 2021, with employment in leisure and hospitality down 61,000 for the month, after a 536,000 plunge in December. The restaurant booking service Open Table reports the number of seated diners at U.S. restaurants is down about 50% to 60% against year-ago figures for the first five weeks of 2021.
The weakness in services correlates with implied gasoline demand statistics. During the 11-weeks from late November 2020 to the end of January 2021, EIA data shows gasoline supplied to the U.S. market below 8 million bpd for eight of these weeks, while averaging 7.77 million bpd during the period.
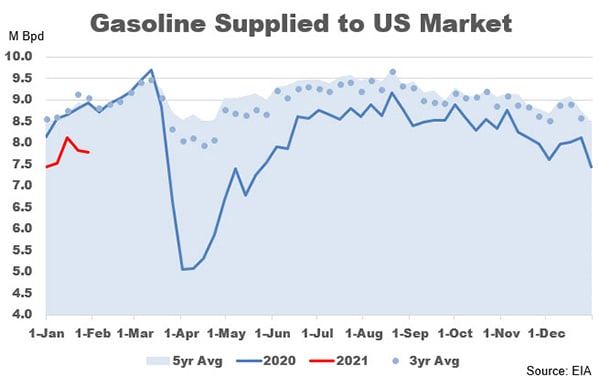
Gasoline supplied to the U.S. market; note the large drop in demand amid early shutdowns at the start of the pandemic and summer increases supported, in part, by outdoor vacations and increased RV and light-vehicle sales.
The leisure and hospitality subcategory within the Labor Department’s monthly report is one to keep an eye on. Employment in leisure and hospitality fell by 8.2 million during March and April 2020 but increased by 4.9 million from May to November, before again declining by 597,000 in December and January. Since February 2020, employment in the leisure and hospitality industry is down 3.9 million or 22.9%.
Most economic data lags real-time, but understanding the underlying economic activity provides crucial information in your analysis. Where possible, cross reference national with state and local data to magnify your understanding of your market. Especially in our COVID-19 world, layering in relevant mobility and high-frequency data will amplify your understanding of your market’s underlying economic activity, allowing you to recast your understanding of what’s occurring in real-time to fine-tune supply needs.
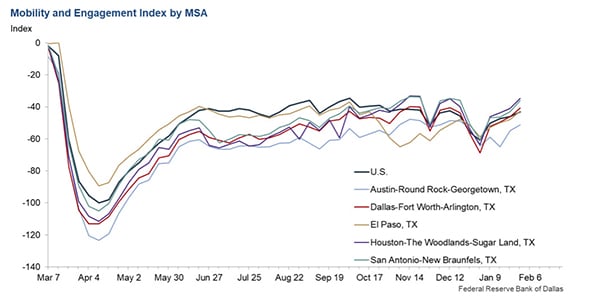
Mobility and engagement data, shown here, can enhance your understanding of a market and help you recast your knowledge of what is occurring so that you can fine-tune supply needs.
Since the pandemic took root in the United States in early 2020, a host of data sets have been offered to show driving activity in select cities, as well as high-frequency data that provides numerous data points intraday. Seek these data sets out to be better informed and better gauge refined fuels demand in your market.