


 Comprehensive weather insights help safeguard your operations and drive confident decisions to make everyday mining operations as safe and efficient as possible.
 Learn how to optimize operations with credible weather and environmental intelligence. From aviation safety to environmental compliance, our comprehensive suite of solutions delivers real-time insights, advanced forecasting, and precise monitoring capabilities.
 2021 Hurricane Season Oil and Gas Market Outlook
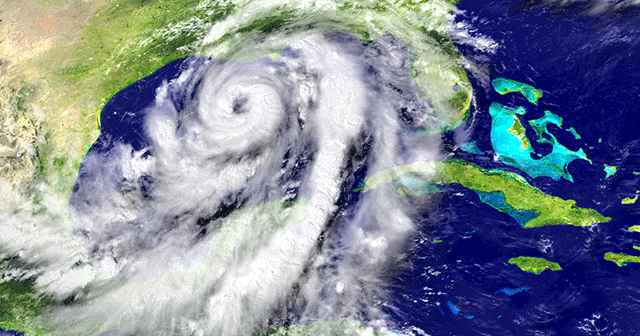
Early last October we published a blog detailing just how long a lifeline the Atlantic hurricane season had thrown to all of those hoping for lower crude oil inventories and higher oil prices. While this year meteorologists are calling for yet another more-active-than-normal storm season in the Atlantic, as I discussed in last week’s webinar, the risk to energy infrastructure and market fundamentals looks much different than what was seen in 2020. With the seasonal peak in hurricane activity in the Atlantic just a few weeks away, for oil and gas market participants it’s time to take a serious and detailed look at how this year’s hurricane season is likely to impact market fundamentals and operations.
With the record-setting Atlantic hurricane season of 2020 came the largest impact to offshore oil and gas production since Hurricanes Gustav and Ike back in 2008. Of the record-setting 30 storms in the 2020 season, six storms impacted Gulf of Mexico offshore oil and gas production. And of those six, three in particular – Laura, Marco, and Delta – were responsible for the majority of shut-in production. In total, the six storms shut in just over 41 million bbl of offshore crude production last year.
For this hurricane season, our DTN meteorology team is forecasting 21 named storms, nine hurricanes and four major hurricanes. While the hurricane season extends from June through November, most tropical systems occur between the middle of August and the middle of October, with the seasonal average peak coming in mid-September. This year, our meteorologists forecast the hurricane season to remain active well into November, with the higher number of total storms expected reflecting that extended season rather than an extraordinarily active September and October.
However, what matters most for oil and gas markets is not the number of storms or even the intensity of storms, but rather where storms track and ultimately make landfall. It is the directional bias of storms for the season that is key to the relative risks posed to oil and gas infrastructure and market fundamentals. In that regard, despite the expected higher-than-normal number of storms this year, our meteorologists are calling for a very different storm season compared to last year.
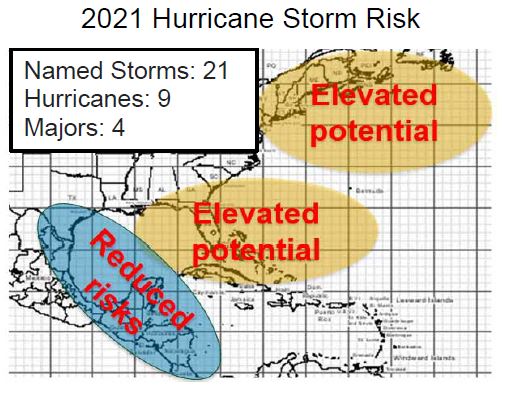
This year, our meteorological forecast is calling for elevated hurricane risk in the eastern Gulf of Mexico and along the East Coast. The expectation is for reduced storm risks in the western Gulf of Mexico. The relative east vs. west geographic risk profile for storms this season should be a major relief for everyone operating offshore wells, Gulf Coast refiners and those operating Gulf Coast import/export terminals.
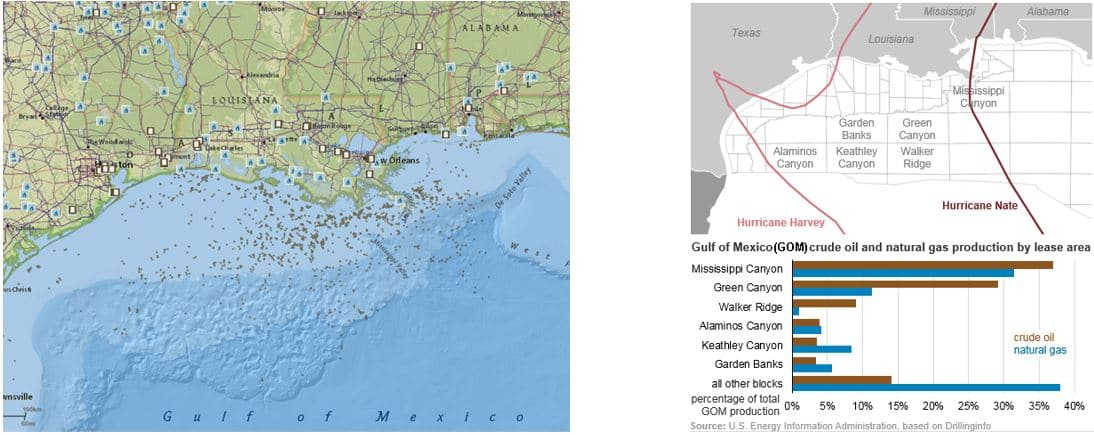
Offshore federal Gulf of Mexico crude oil production currently accounts for 16% of total U.S. crude oil production. Roughly 70% of offshore oil and gas production is located west of New Orleans, and nearly all of Gulf of Mexico federal offshore oil and gas production is west of Pensacola. A storm season with an eastward bias that would largely avoid territory west of New Orleans would be very different than what occurred last year. Tropical Storm Fred, which recently made landfall near Panama City, Florida, is a great example of how a storm holding to the eastern Gulf of Mexico is little-to-no threat for oil and gas production.

The next variable we should discuss is refining capacity. The Gulf Coast currently accounts for nearly 54% of the total national operable refining capacity. With the vast majority of U.S. refining capacity located in Texas and Louisiana, a storm season that primarily sees increased activity along the eastern Gulf of Mexico and East Coast significantly reduces the risks posed to refinery runs relative to what we saw in 2020.
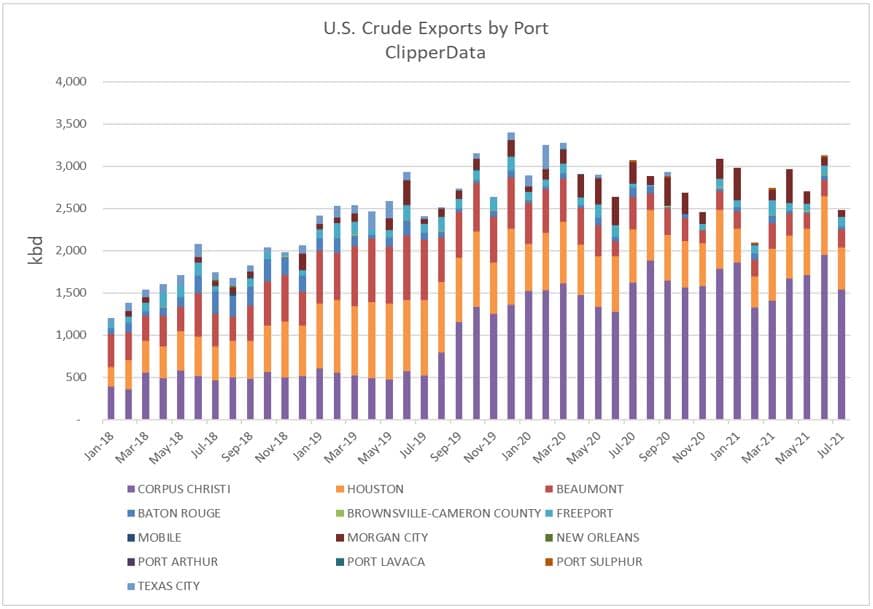
Even more geographically concentrated than U.S. production or refinery capacity, U.S. crude export capacity is heavily weighted to the region west of Beaumont, TX. In fact, according to ClipperData, nearly 90% of U.S. crude exports are loaded west of Beaumont and primarily come from Corpus Christi, with smaller volumes from Houston and Beaumont. Given that export capacity is so heavily weighted toward the western Gulf Coast, the outlook for reduced storm risk in the region means exports are unlikely to be materially impacted in the coming weeks.
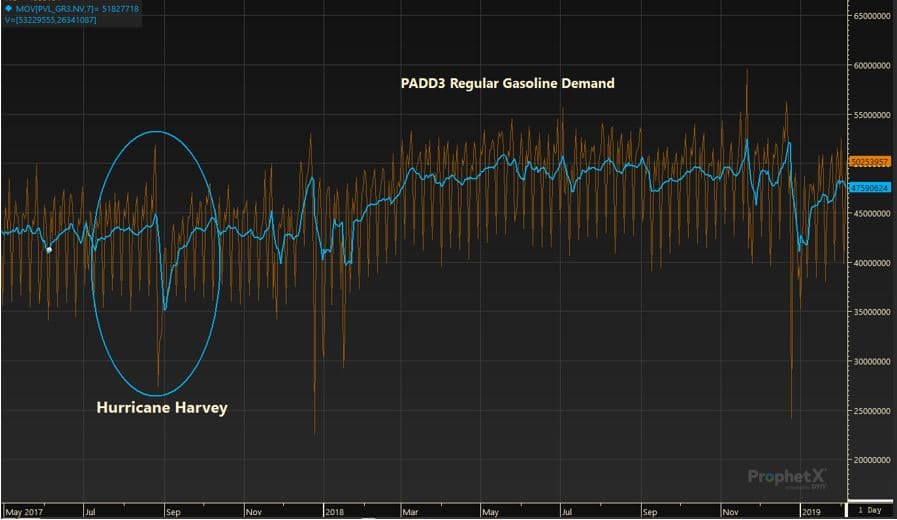
Hurricanes serve up a bit of a mixed bag when it comes to the impact on refined fuel demand. Typically, we see an initial increase in demand as people prepare for the approaching storm; making sure there’s fuel for electrical generators or to fuel their cars in preparation of the potential need for evacuation, followed by a lull in demand amid the arrival of inclement weather. With more severe storms—particularly those with lingering damage like flooding—the bearish decline in demand is far clearer and more pronounced. Using our proprietary Refined Fuels Demand data, you can see the lasting impact of a large, damaging storm with lingering floods like Hurricane Harvey; but far less noticeable are last year’s storms. With the lingering impacts of severe flooding, Gulf Coast gasoline demand plummeted 22% in the wake of Hurricane Harvey. While Harvey’s arrival admittedly coincided with the typical seasonal decline in demand following the Labor Day holiday weekend, the 22% decline in demand amid Harvey compares with just a 6% normal seasonal decline in demand for the period.
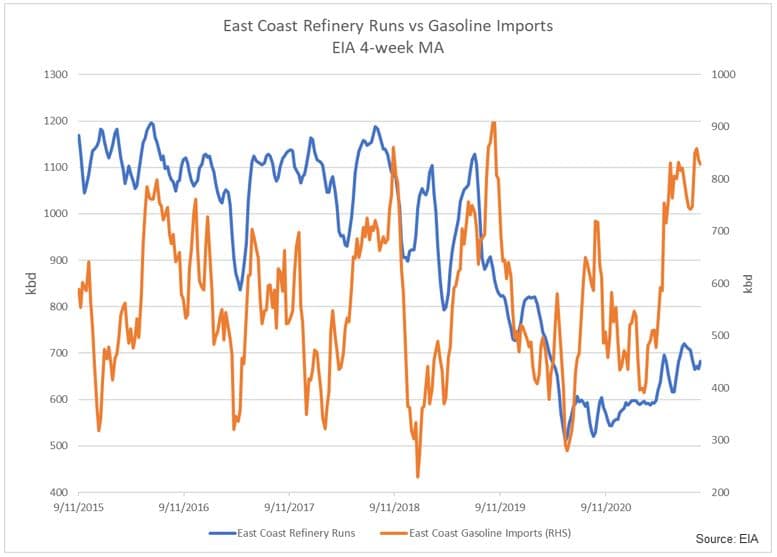
While the primary focus of any hurricane season analysis should be on the Gulf Coast region (given its concentration of oil and gas infrastructure), the elevated potential for East Coast hurricanes this year means an elevated risk of impacting one of the largest regional sources of refined fuel demand globally. Furthermore, it’s worth noting that the East Coast gasoline market has changed in the COVID era. East Coast gasoline demand is currently only 3% below August 2019 levels, and regional diesel demand is in line with 2019 levels; yet refinery runs in the region are 25% lower than the same period in 2019. The East Coast has increasingly imported refined products to meet regional demand over the past year, taking advantage of the global surplus of fuels and open arbitrage between East Coast and Northwest European pricing. As such, the outlook for elevated East Coast storm risks this season means an increased risk of delayed arrivals of fuel imports and temporarily larger-than-normal draws to fuel inventories. However, given that spare refining capacity along the Gulf Coast and Midwest is higher than normal, and that storms hitting population centers on the East Coast would likely weigh on demand, we do not foresee this hurricane season causing shortages of fuel at the wholesale or retail level in the region.
For natural gas markets, the risks posed by hurricane season are far fewer and less severe than the potential impact on crude oil and refined product markets. Only about 2% of U.S. natural gas is produced offshore in the Gulf of Mexico, compared to around 16% of U.S. crude oil production. The biggest risks to natural gas infrastructure come by way of natural gas processing plants and export facilities. Close to 50% of total U.S natural gas processing plant capacity is in the Gulf Coast region, but like oil refineries are geographically weighted heavily to the west of New Orleans.
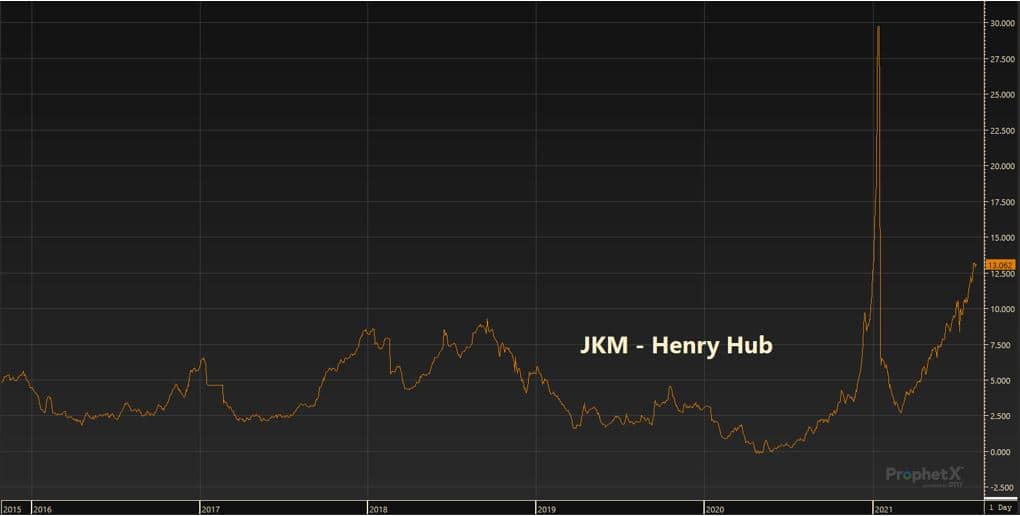
At nearly $4.00 MMBtu currently, U.S. natural gas prices are their highest since the winter of 2018 and are at their highest non-winter price since 2014. High summer temperatures in east Asia this summer coupled with nuclear generation issues in Japan have helped push the Japan Korea Marker (JKM) LNG price to its largest non-winter premium to Henry Hub futures since 2012. But it hasn’t only been the pull on U.S. cargoes to Asia: surging LNG demand has also been seen in Europe and Latin America this year, pulling total U.S. LNG exports to a record-high. Amid production weakness and record-strong exports, U.S. natural gas inventories have dropped to 5% below the five-year average and are 16% lower year-on-year.
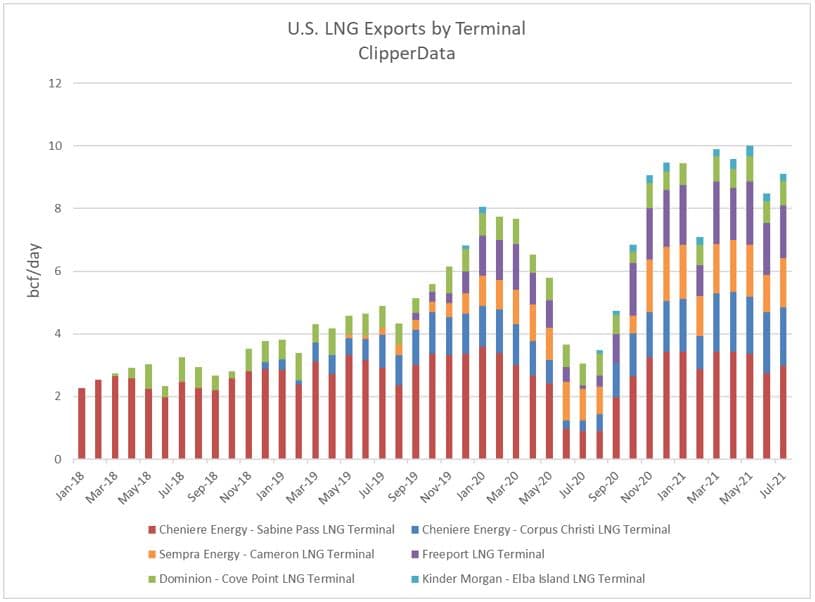
LNG exports from the U.S., like crude exports, are extremely geographically concentrated to the western Gulf of Mexico. According to ClipperData, nearly 90% of total U.S. LNG exports are loaded along the Gulf Coast, west of Lake Charles. This means one of the most bullish factors for U.S. natural gas prices this year—record-strong LNG exports—is unlikely to let up because of hurricane disturbances. Amid hurricanes Laura and Marco in 2020, the Sabine Pass and Cameron LNG terminals shut down operations in anticipation of approaching storms, just like refiners and offshore producers. If exports are shut off amid hurricanes this season, it will initially lead to larger domestic natural gas storage builds and weigh on US natural gas prices. But it will in turn cause global LNG cargoes to become more scarce and cause global LNG to push even higher; likely pulling harder on LNG exports once terminals reopen.
Even with storm risk skewed to the East Coast and eastern Gulf of Mexico this year, given the high number of total storms expected this season, it shouldn’t come as a surprise if one storm strays further west and impacts oil and gas operations in Louisiana and Texas. However, on average for the season, the risks posed to oil markets are not nearly as bullish as last year and are clearly more likely to impact refined fuel demand than crude oil production and refining operations. Therefore, although we face a more-active-than-normal storm season for a second consecutive year, this is not the same storm season we saw last year when it comes to oil and gas market risks.