


 Comprehensive weather insights help safeguard your operations and drive confident decisions to make everyday mining operations as safe and efficient as possible.
 Learn how to optimize operations with credible weather and environmental intelligence. From aviation safety to environmental compliance, our comprehensive suite of solutions delivers real-time insights, advanced forecasting, and precise monitoring capabilities.
 Fuel Prices Ride the Waves of Market Fears and Disruptions

Refined product crack spreads had been rising steadily since late 2020 and remained at elevated levels throughout 2021 and early 2022 as fuel demand recovered globally against a backdrop of significant refining capacity losses the year prior, leading to steady large draws to product inventories – particularly in the US. In reaction to the Russian invasion of Ukraine and the potential for supply disruptions to Russian crude oil and refined products, the 3:2:1 crack vs. Brent rocketed from $19/bbl to a record high $62/bbl last spring. Cracks softened over last summer as gasoline prices fell more rapidly than crude oil prices amid marked gasoline demand weakness, but the 3:2:1 still remained above $25/bbl given strength in diesel prices. By mid-year however, it was clear that high prices and a slowing global economy were also weighing on diesel demand.
After sliding lower since peaking in mid-June, refinery strikes and outages in Europe during October exacerbated a global middle distillate shortage and propelled diesel prices higher once more. In combination with precariously low inventories on the US East Coast, these strikes pushed the 3:2:1 close to record highs on the back of surging diesel cracks, peaking at around $49/bbl in late October. Subsequently, the 3:2:1 crack spread fell swiftly to eight-month lows of $20/bbl on the back of continued product demand weakness in the US, French strikes drawing to a close, and rising inventories.
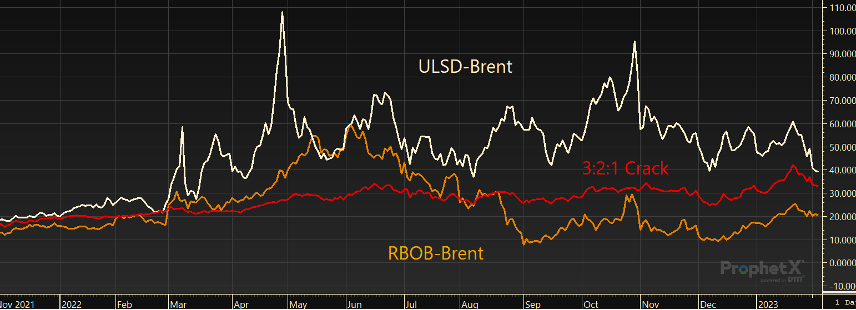
Diesel shortages, refinery outages and sanctions: how cracks remained immensely high throughout 2022.
Moving through early December, refined product prices were continuing to tumble lower after hitting their Q4 peak in late October. By December 12, New York Harbor RBOB prices had hit their lowest since December 2021. At just $2.02/gal RBOB prices had collapsed 33% since their October peak and were down 53% from their record highs set in early June. Likewise, New York Harbor ULSD prices had collapsed 41% from their October highs by early December at just $2.67/gal and were down 53% from their record highs set in April.
This sharp decline in refined product prices followed what looked to be a major turning point in US inventories. US total gasoline stocks bottomed in the week ending November 4 at 205.7 million bbls and just two weeks later the US East Coast (which had been the primary regional area with low inventories) also saw gasoline inventories bottom and begin heading higher. By mid-December, US gasoline stocks had risen 20.4 million bbls, or 10%. At that point, distillate fuel oil inventories in the US had already bottomed and began heading higher despite the fact that demand for the fuel used for heating oil in the US northeast and for transportation of holiday goods typically doesn’t peak until later in November. In 2022, distillate fuel oil demand peaked nearly a month ahead of normal. Distillate fuel oil stocks bottomed in the week ending October 7 and rose 14.1 million bbls, or 13%, by mid-December. The US East Coast, home to both the ULSD New York Harbor futures contract and the vast majority of US heating oil demand, had received particular attention going into winter over fears of depleted inventories. However, even there, inventories bottomed in the week ending October 21 and rose 42% or 10.1 million bbls by mid-December.

Winter storms: despite steady crude prices, cracks shot through the roof in December.
Just as refined product stocks were starting to be materially replenished after two years of depletion, Winter Storm Elliot brought historically cold blizzard conditions to much of the country. Record cold temperatures, high winds and power outages led to equipment failures across the oil and gas industry. Oil and gas output at the wellhead suffered freeze-ins in multiple regions. But more importantly for the trajectory of refined product inventories, oil refiners were forced to drastically reduce crude throughput. Crude inputs at US refiners plummeted from 16.1 million bpd in the week ending December 23 to just 13.8 million bpd in the week ending December 30 according to EIA data. This caused refiner and blender production of finished motor gasoline to plummet from 10.1 million bpd to 8.5 million bpd and production of distillate fuel oil to drop from 5.1 million bpd to 4.0 million bpd in the final week of the year.

Refinery Runs: Winter Storm Elliot and unplanned outages left a lasting impact on refinery runs through January.
Just as refined product prices had been pushed higher by unplanned temporary disruptions in early Q4, the winter storm lifted product prices and cracks once more. This latest rise, however, was propelled by RBOB rather than ULSD. In fact, the ULSD-RBOB differential has sharply narrowed since November, falling from a peak of $1.64/bbl at the end of October to $0.44/bbl currently. While middle distillate prices fell in response to soft demand and rising inventories once more in early January, gasoline prices firmed despite lackluster demand in anticipation of the next risks on the horizon – reduced flows from Europe to the US East Coast resulting from the G7 price cap on Russian refined products and refinery maintenance season. US refinery runs remained depressed through January as some refiners had continued struggles following the winter storm and others were hesitant to ramp back up activity with planned maintenance just days away. As refinery runs remained depressed while we worked through January, RBOB led the fuel price charge higher, causing a resurgence in cracks spreads.
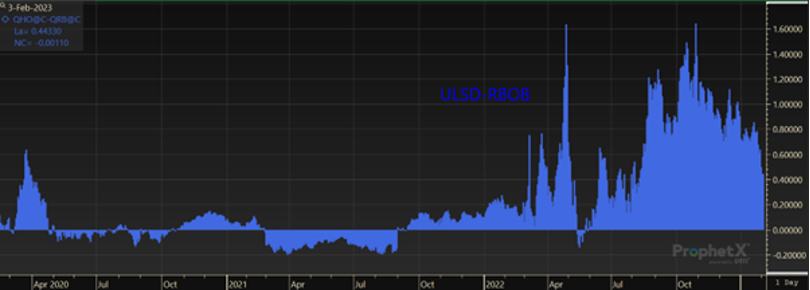
While far from “normal,” the ULSD-RBOB differential has narrowed sharply since November.
While known for months, the rapidly approaching February 5 deadline for the EU’s embargo on Russian refined products, prohibition on EU vessels transporting Russian product and the G7’s price cap on Russian oil products began to materialize into growing anxiety of a renewed tightening in the Atlantic Basin refined product market. The New York Harbor market, where US refined product futures benchmarks are priced, is particularly susceptible to the potential impact of lower European gasoline production and exports as Europe is the largest supplier for East Coast importers historically.
These fears, like those surrounding the EU embargo and G7 price cap on Russian crude oil also proved short-lived. RBOB prices did a U-turn immediately following the EU Commission proposal in late January of a $100/bbl price cap for premium refined Russian fuels (diesel and gasoline) and $45/bbl cap for low quality products (like fuel oil and feed stocks), rendering the expected impact on product supply muted. The 3:2:1 crack peaked on January 23 at $42.10/bbl and began to swiftly tumble lower.
Just a few days before the EU embargo and price cap on Russian refined products went into effect, the EU finally agreed to codify their proposed caps of $100/bbl for premium products and $45/bbl for low quality products. With the price caps set at a level that is above the market price for RBOB gasoline and nearly in line with the market price for diesel, Russia should continue refining and exporting as usual. While tanker capacity outside of EU maritime services remains a consideration, for now it looks that tanker capacity will be sufficient. Russian refined products will likely increasingly flow into the Middle East, Africa, Asia, the Caribbean and Latin America, with longer voyage times and higher freight costs being a key component that will help suppress prices for Russian products. This may mean lower gasoline exports from Europe to the US East Coast and East Coast importers having to increasingly turn to Indian and Middle Eastern suppliers in the coming months.
The next rapidly approaching bullish risk for refined fuels on the horizon is a deeper-than-usual US refinery maintenance season. Spring refinery maintenance season in the February-May period is expected to take double the refining capacity offline as compared to recent historic norms. IIR Energy expects 1.4 million bpd of capacity will be offline by mid-February. This follows a year of refiners running as hard as possible and minimizing refinery downtime to take advantage of the record-strong refining margins we discussed above. Nine US refineries are expected to shutter at least part of their crude processing units during the spring maintenance season. Reduced refinery runs are clearly not bullish for US crude oil prices. The front end of the WTI forward curve has traded in contango for over a month now, and Cushing crude inventories have risen 14.1 million barrels, or 59%, since the beginning of December. However, many market participants had expected crack spreads to continue to hold up given that reduced crude throughput also implies reduced refined product output. But what if demand is weak enough to limit the pull on refined product inventories despite extremely weak refinery runs?
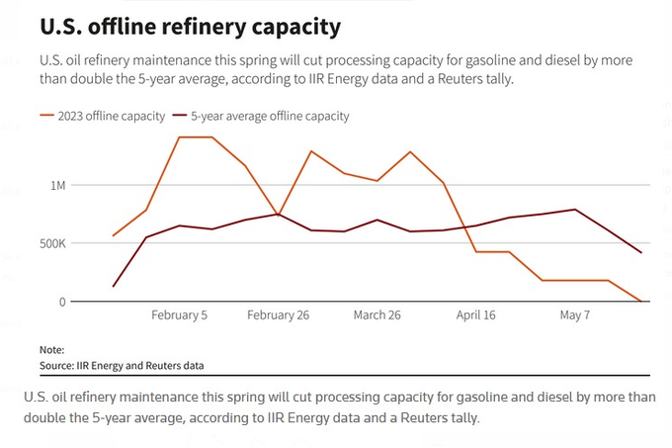
Maintenance Season: IIR data points to a doubling in offline capacity compared to recent norms.
This is exactly what we’ve seen transpire in the first month of the new year. Despite US refiner net inputs of crude oil down 4% from year-ago levels and 13% below 2019 levels (and refinery utilization rates averaging 9% below 2019 levels for the month), product inventories proved resilient. US gasoline stocks rose 11.9 million bbls over the month in the week ending January 27 despite gasoline exports averaging their highest on record for the seasonal period according to EIA data. Exports of gasoline were up 84%, or 412,000 bpd from year-ago levels and up 34% or 227,000 bpd from 2019 levels for the period. Gasoline imports, meanwhile, were up just 74,000 bpd from year-ago levels and 1% above 2019 levels.
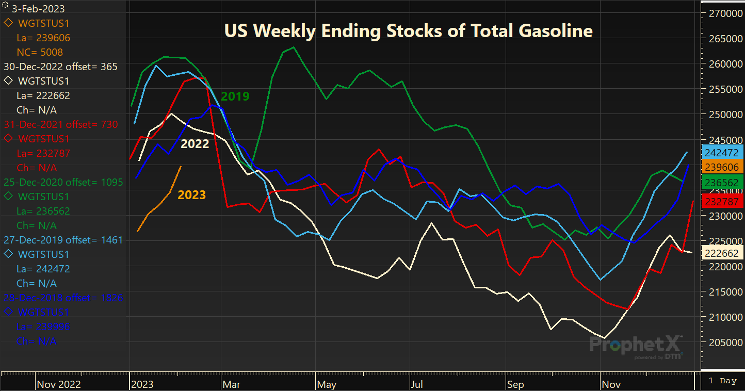
Gasoline inventories: Gasoline inventories, while still low are making a comeback.
US distillate fuel oil stocks fell just 1.2 million bbls from the week ending December 30 to the week ending January 27, compared with a 4.1 million bbls decline for the same period last year. The small draw to distillate inventories also came despite pronounced strength in US exports of distillate fuel oil, which were 84% or 412,000 bpd above year-ago levels for the month and 34% or 227,000 bpd above 2019 levels for the period. Distillate fuel oil imports were down 1% from year-ago levels and down 12% from 2019 levels in January. In totality, these data all strongly point to pronounced demand weakness.
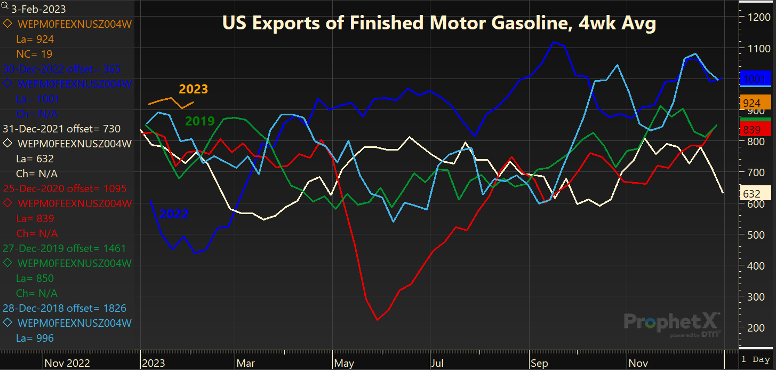
US Gasoline Exports: Exports of gasoline remain at seasonal record highs.
The EIA’s proxy for demand, product supplied, has been screaming weakness in gasoline and distillate fuel oil demand since Q2 2022. Weekly US product supplied data for January show gasoline demand down 2% from year-ago levels and 10% or 871,000 bpd below 2019 levels for the period. Distillate fuel oil product supplied was down 13% or 578,000 bpd from year-ago levels and averaged 5% below 2019 levels for the period. Jet fuel demand was up 1% or 9,000 bpd from year-ago levels but remained 11% below 2019 levels for the month through the week ending January 27. While we acknowledge that weekly EIA data overstated the degree of demand weakness in 2022, monthly data and product balances confirm significant demand weakness for these fuels persisting through the final three quarters of the year.
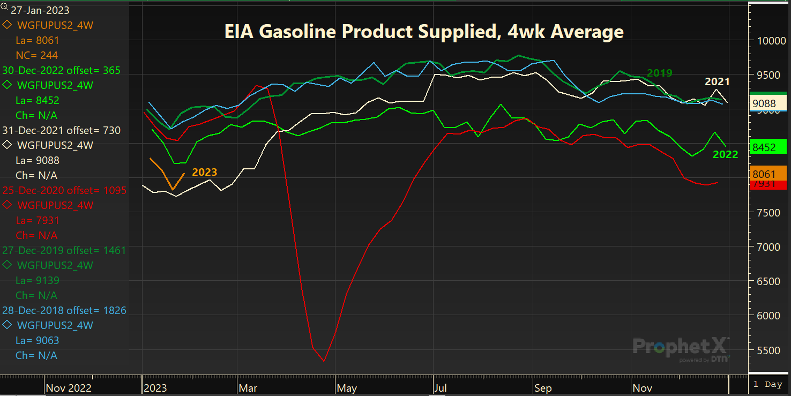
Gasoline demand proxy: Gasoline demand continues to suffer moving through early 2023.
Although the 3:2:1 crack spread remains elevated relative to historic standards at $30/bbl as gasoline and distillate fuel oil inventories linger well below historical norms, continued demand weakness for diesel and gasoline in the US is causing many to re-think what depleted inventories really mean in the context of demand looking forward. Gasoline demand looks set to continue to suffer from the rise of retirements and work from home, which both limit commuter demand. At the same time, diesel demand has crashed back to earth after surging amid a post-COVID freight boom to restock goods inventories globally which are now brimming.
Days of cover, or how many days inventories can cover the pace of consumption, has been rising swiftly since early November. Days of cover for distillate fuel oil are up from their October lows of 25 days to 30.5 days. This is down only slightly from the same period in 2019 when days of cover were at 31, and up from year-ago levels when days of cover sat at 27.7. Gasoline inventories in terms of days of cover are up to 29 from 23 in the first week of November and up from 27.7 at this time last year. Gasoline days of cover are also up from 2018 levels and in line with 2019 levels for the seasonal period.
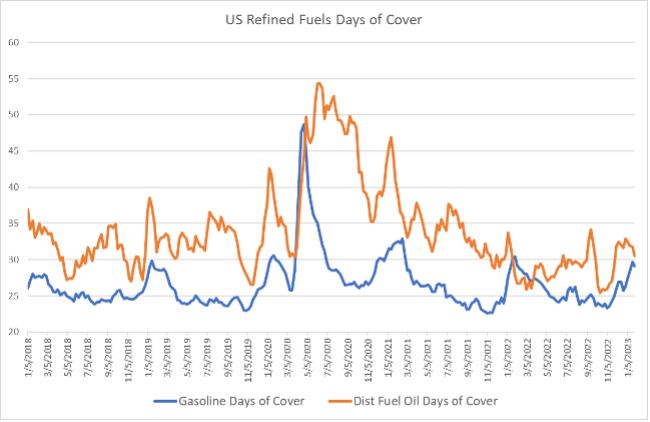
Days of Cover for refined fuels have staged a comeback over the past few months.
In the near term, we face another couple of months of depressed US refinery runs amid maintenance season, which is clearly bearish for US crude oil prices and will likely help keep refining cracks elevated even amid demand weakness for fuels. This is good news for companies like Exxon, who should currently be in the process of initial startup of their 250,000 bpd Beaumont, Texas refinery expansion using domestic crude to boost gasoline and diesel production just as maintenance begins elsewhere. However, for now, continued weakness in US refined product demand amid a sluggish US economy – particularly, marked weakness in manufacturing and industrial activity – can’t be ignored.
Seasonally speaking, domestic gasoline and diesel demand should be expected to trend higher in the coming weeks. However, as has been the case for the past two years, the global appetite for US crude and products via the export market looks set to be the key determinate of the direction of US inventories over the next few months and likely oil prices more broadly. A widening Brent-WTI spread should continue to encourage strong crude exports, but if product export strength does not overwhelm the impact of domestic fuel demand weakness over the next four to eight weeks, crude and product inventories are likely to continue to rise simultaneously.
About the Authors
Troy Vincent
Troy Vincent is a senior energy market analyst at DTN. He worked at the Charles Koch Institute and studied at the Mises Institute while completing his Bachelor of Science in business economics and public policy from Indiana University and has been in the economic research and energy risk management industry for the past decade. Throughout that period, he has served as an analyst covering electricity, carbon dioxide, coal, natural gas, crude oil, and refined products markets. After advising companies on their energy risk management strategies while at Schneider Electric and Trane, Vincent served as a senior oil market analyst for innovative technology startup ClipperData, providing actionable intelligence for oil traders and investors. He currently specializes in crude oil, natural gas, and refined products markets; you can find his past comments and analysis across industry reports from RBN to Barron’s, MarketWatch, and Bloomberg.
Karim Bastati
Karim Bastati is a market analyst at DTN. Bastati has nearly a decade of experience in data analysis, spending the last few years in the energy industry interpreting data and building predictive models. He often acts as the central link between quantitative and qualitative research, joining an extensive knowledge of global oil markets with an analytical, numbers-oriented approach. In his previous position at ClipperData, he authored several weekly reports on crude oil and petroleum products, delivering data-derived insights.
For more in-depth fuel market analysis, visit our Energy Insights page.