


 Comprehensive weather insights help safeguard your operations and drive confident decisions to make everyday mining operations as safe and efficient as possible.
 Learn how to optimize operations with credible weather and environmental intelligence. From aviation safety to environmental compliance, our comprehensive suite of solutions delivers real-time insights, advanced forecasting, and precise monitoring capabilities.
 Signs of Stabilization Amid Data Volatility and Extreme Uncertainty

Key Developments:
– The IEA revised oil demand lower by 500,000 bpd for both Q3 and Q4 from their July outlook, but expects draws to global oil inventories every month through the remainder of the year.
– By December, the EIA estimates crude oil inputs at U.S. refiners will return to normal; averaging just 70,000 bpd below year-ago levels for the month at 16.72 million bpd.
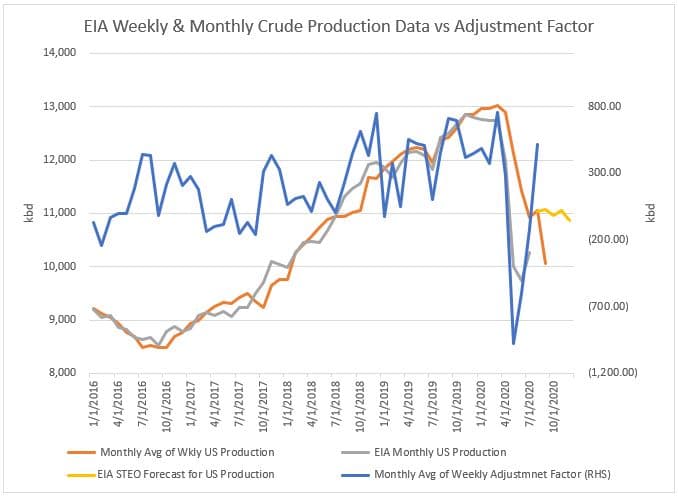
– With a 300,000 bpd downward revision to U.S. crude production in their weekly report, the EIA now looks to be underestimating production by roughly 400,000 bpd.
LOUISVILLE, Ky. (DTN) — If there’s one thing that is certain in today’s oil market, it’s that uncertainty is near extremes. With growing tensions between the world’s two largest economies, the global pandemic dragging on through the summer and the potential for a second wave of COVID-19 cases moving through the fall, the risk to market outlooks abound. While some analysts are calling for peak oil demand in 2019 and the general demise of the industry going forward, others call for a coming severe shortage in supply amid the steep production decline rates of U.S. shale wells and years of under-investment in new production elsewhere. But this is not an either/or proposition. We expect the truth lies somewhere between those two extremes, as it often does.
Data releases and outlooks from the EIA, IEA, and OPEC over the past week point to a market that is stabilizing. Even as we agree with this general thesis of a stabilizing market, it’s important to recognize that this view hinges upon staving off a major second wave of COVID-19 moving toward winter. And that is far from certain.
IEA Outlook
In the August edition of the IEA’s Oil Market Report (OMR), the Agency lowered their 2020 global oil demand outlook from their July report by 200,000 bpd, calling for an 8.1 million bpd decline in oil demand this year. Oil demand was revised lower by 500,000 bpd for both Q3 and Q4 from the July outlook. This largely reflects the IEA’s downbeat view on jet fuel and gasoline demand following the recent rebound in COVID-19 cases but does not factor in a potential second major wave of economic inactivity due to a second wave of COVID-19 cases moving into winter.
OPEC+ output was reported rising 1.3 million bpd in July and is likely to rise another 600,000 bpd in August according to the IEA. This comes in addition to a recovery in oil production in the U.S. & Canada. Like the EIA did in late July, the IEA reported that U.S. production sank far deeper than previously expected back in Q2, which helped lead the global supply-demand balance into deficit by June. The IEA acknowledges that we are in a “delicate re-balancing,” but concludes that global demand outpaced supply beginning in June and will continue to do so throughout the remainder of the year, leading to sustained draws to global inventories.
EIA Short Term Energy Outlook
The EIA’s August Short Term Energy Outlook (STEO) offered a similarly optimistic view about stock draws in the U.S. in the second half of the year and reflected recent revisions to monthly crude production data. The EIA expects U.S. production to average 10.88 million bpd in the second half; a 320,000 bpd downward revision from their report last month. This month’s report also reflected the large miss in weekly production estimates in the May-July period. Production for the May-July period was revised lower by an average of 1.18 million bpd.
The EIA expects total commercial crude and products inventories to fall in each and every month from July 2020 through March 2021. Crude stocks are expected to fall 56.1 million bbl in the second half of 2020 due primarily to an expectation of weakening crude production and normalizing refinery runs.
The EIA projects crude oil inputs at U.S. refineries rising from July’s pace through September, bucking the seasonal trend of a sharp downturn in refinery runs in late Q3 due to maintenance. Furthermore, the EIA projects refinery runs surging 680,000 bpd in November from October’s pace before propelling an additional 820,000 bpd in December from November. By December, the EIA estimates that crude oil inputs at U.S. refiners will return to normal, averaging just 70,000 bpd below year-ago levels for the month at 16.72 million bpd.
The biggest risk to this outlook of a stabilizing market remains the potential for refinery runs turning lower in response to another wave of COVID-19 cases moving into the winter. All else equal, if refinery runs peaked at the EIA’s expected pace for August and held at this 15.21 million bpd rate throughout the remainder of the year (instead of heading higher through Q4), this would leave stocks 73.2 million bbls higher than the current outlook. While the build would not likely be this large in actuality (as refiners would curtail crude imports in response to lower demand), it’s important to note how quickly weakness in refinery runs can add up.
Even without a major second wave of COVID-19 cases this fall that leads to another round of societal lock-downs, our outlook for economic growth indicates that the EIA’s forecast for refinery runs normalizing by December is overly optimistic.
Weekly EIA Data
This week’s EIA report showed only the second week this year with simultaneous draws to crude, gasoline and distillate fuel oil stocks. In early July, we concluded that both weakness in net imports of crude and strength in net exports of refined products would be crucial for the sustained draws to stocks necessary to push crude prices higher in the coming days. It was our view then that U.S. crude production was rebounding and that for inventories of crude to draw down, a sharp decline in net imports was needed. This downturn in net imports of crude is exactly what has followed since early July, and crude prices—although not ripping higher since that time—have ticked higher on supportive stock draws.
For the week ending August 7, U.S. net imports of crude oil fell 713,000 bpd from the prior week to 2.47 million bpd. Based on weekly data, net imports of crude were down 51% from year-ago levels. And this isn’t just an outlier in the weekly data. On a four-week moving average basis, net imports of crude are down 1.89 million bpd, or 42%, year-on-year.
After falling to just 1.57 million bpd in mid-May, net exports of refined products had nearly doubled by mid-July, reaching just over 3.09 million bpd. However, on a four-week moving average basis, net exports of total products have been easing lower since mid-July. As U.S. product demand has gradually recovered and refinery runs have remained weak, last week imports of total petroleum products hit their highest since the end of March on a four-week moving average basis. Narrowing product net exports due to strengthening imports (instead of collapsing international demand for our gasoline and diesel) is certainly a constructive development.
Two other key observations in the weekly data this week come from a revision to crude production and refinery capacity. This week’s report showed U.S. crude production dropping 300,000 bpd from the prior week. But in fact, crude production did not drop in reality. This is merely a matter of methodology due to re-benchmarking.
Given new monthly data showing the sharp decline in production back in May, the EIA revised lower current production. But as we have pointed out in recent months, the EIA was overestimating production then, which would lead them to underestimate production now.
Indeed, this 300,000 bpd cut to production led the adjustment factor to push higher week-on-week to average 515,000 bpd. This trend of a positive weekly adjustment to account for the EIA’s underestimation of crude production should continue in the weekly data until the EIA either re-benchmarks higher once again, or actual production begins to fall as we progress through the year and come closer in line with EIA estimates.
Lastly, while the weekly data would lead you to believe refinery utilization exceeded 80% for the first time since March, this too is a figment of the data. The EIA finally cut PADD 1’s operable refinery capacity last week to account for the PES refinery (which has been offline since last June). This helped bring PADD 1 refinery utilization to 71.8% of operable capacity instead of the 52.1% utilization rate reported in the prior week.
Conclusion
This week’s EIA data, in addition to the monthly outlooks from the IEA and EIA, are supportive of a constructive view on market rebalancing and oil prices. We are in agreement with both agencies that the market is stabilizing, but we believe the EIA is currently underestimating U.S. crude production by roughly 400,000 bpd and is too optimistic on U.S. refinery runs in expecting a return to normal operations by December.
Even optimistically assuming the EIA’s projection for draws to crude and product inventories for nine consecutive months through March of next year is correct, the EIA still expects March 2021 commercial crude and products inventories to be 99 million barrels above March 2019 levels.
Given this outlook for inventories and the risk of disappointing economic growth later this year (amid a potential second wave of COVID-19 cases), we believe the risk to current base case outlooks from the EIA and IEA for the second half of 2020 are skewed to the downside.
Troy Vincent, 1.270.543.9260, [email protected], www.dtn.com.